
Page 145 - Advanced Thermodynamics for Engineers, Second Edition
P. 145
132 CHAPTER 6 FINITE TIME (OR ENDOREVERSIBLE) THERMODYNAMICS
1.0
Temperature ratio of low temperature engine 0.8
0.9
0.7
0.6
0.5
0.5 0.6 0.7 0.8 0.9 1.0
Temperature ratio of high temperature engine
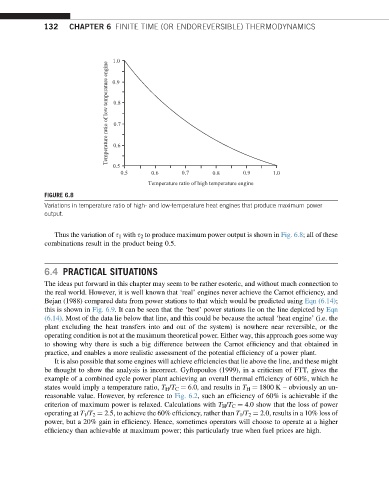
FIGURE 6.8
Variations in temperature ratio of high- and low-temperature heat engines that produce maximum power
output.
Thus the variation of s 1 with s 2 to produce maximum power output is shown in Fig. 6.8; all of these
combinations result in the product being 0.5.
6.4 PRACTICAL SITUATIONS
The ideas put forward in this chapter may seem to be rather esoteric, and without much connection to
the real world. However, it is well known that ‘real’ engines never achieve the Carnot efficiency, and
Bejan (1988) compared data from power stations to that which would be predicted using Eqn (6.14);
this is shown in Fig. 6.9. It can be seen that the ‘best’ power stations lie on the line depicted by Eqn
(6.14). Most of the data lie below that line, and this could be because the actual ‘heat engine’ (i.e. the
plant excluding the heat transfers into and out of the system) is nowhere near reversible, or the
operating condition is not at the maximum theoretical power. Either way, this approach goes some way
to showing why there is such a big difference between the Carnot efficiency and that obtained in
practice, and enables a more realistic assessment of the potential efficiency of a power plant.
It is also possible that some engines will achieve efficiencies that lie above the line, and these might
be thought to show the analysis is incorrect. Gyftopoulos (1999), in a criticism of FTT, gives the
example of a combined cycle power plant achieving an overall thermal efficiency of 60%, which he
states would imply a temperature ratio, T H /T C ¼ 6.0, and results in T H ¼ 1800 K – obviously an un-
reasonable value. However, by reference to Fig. 6.2, such an efficiency of 60% is achievable if the
criterion of maximum power is relaxed. Calculations with T H /T C ¼ 4.0 show that the loss of power
operating at T 1 /T 2 ¼ 2.5, to achieve the 60% efficiency, rather than T 1 /T 2 ¼ 2.0, results in a 10% loss of
power, but a 20% gain in efficiency. Hence, sometimes operators will choose to operate at a higher
efficiency than achievable at maximum power; this particularly true when fuel prices are high.