
Page 172 - Advanced thermodynamics for engineers
P. 172
158 CHAPTER 7 GENERAL THERMODYNAMIC RELATIONSHIPS
This equation is known as the Clapeyron equation. Now, h 2 h 1 is the latent heat, h fg . If point 1 is
on the saturated liquid line and point 2 is on the saturated vapour line, then Eqn (7.79) can be
rewritten as
dp h fg
T ¼ : (7.80)
dT v fg
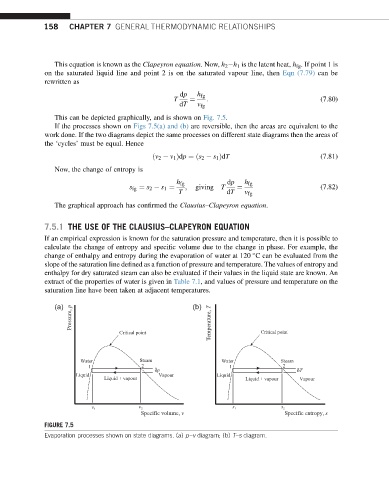
This can be depicted graphically, and is shown on Fig. 7.5.
If the processes shown on Figs 7.5(a) and (b) are reversible, then the areas are equivalent to the
work done. If the two diagrams depict the same processes on different state diagrams then the areas of
the ‘cycles’ must be equal. Hence
ðv 2 v 1 Þdp ¼ðs 2 s 1 ÞdT (7.81)
Now, the change of entropy is
h fg dp h fg
s fg ¼ s 2 s 1 ¼ ; giving T ¼ (7.82)
T dT v fg
The graphical approach has confirmed the Clausius–Clapeyron equation.
7.5.1 THE USE OF THE CLAUSIUS–CLAPEYRON EQUATION
If an empirical expression is known for the saturation pressure and temperature, then it is possible to
calculate the change of entropy and specific volume due to the change in phase. For example, the
change of enthalpy and entropy during the evaporation of water at 120 C can be evaluated from the
slope of the saturation line defined as a function of pressure and temperature. The values of entropy and
enthalpy for dry saturated steam can also be evaluated if their values in the liquid state are known. An
extract of the properties of water is given in Table 7.1, and values of pressure and temperature on the
saturation line have been taken at adjacent temperatures.
(a) (b)
Pressure, p Temperature, T
Critical point Critical point
Water Steam Water Steam
1 2 1 2
δp δT
Liquid Vapour Liquid
Liquid + vapour Liquid + vapour Vapour
v 1 v 2 s 1 s 2
Specific volume, v Specific entropy, s
FIGURE 7.5
Evaporation processes shown on state diagrams. (a) p–v diagram; (b) T–s diagram.