
Page 225 - Advanced Mine Ventilation
P. 225
Respirable Dust Sampling and Measurement 205
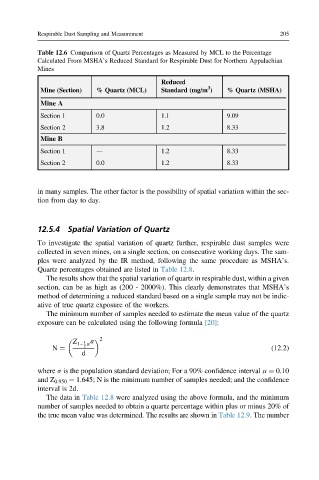
Table 12.6 Comparison of Quartz Percentages as Measured by MCL to the Percentage
Calculated From MSHA’s Reduced Standard for Respirable Dust for Northern Appalachian
Mines
Reduced
3
Mine (Section) % Quartz (MCL) Standard (mg/m ) % Quartz (MSHA)
Mine A
Section 1 0.0 1.1 9.09
Section 2 3.8 1.2 8.33
Mine B
Section 1 d 1.2 8.33
Section 2 0.0 1.2 8.33
in many samples. The other factor is the possibility of spatial variation within the sec-
tion from day to day.
12.5.4 Spatial Variation of Quartz
To investigate the spatial variation of quartz further, respirable dust samples were
collected in seven mines, on a single section, on consecutive working days. The sam-
ples were analyzed by the IR method, following the same procedure as MSHA’s.
Quartz percentages obtained are listed in Table 12.8.
The results show that the spatial variation of quartz in respirable dust, within a given
section, can be as high as (200 - 2000%). This clearly demonstrates that MSHA’s
method of determining a reduced standard based on a single sample may not be indic-
ative of true quartz exposure of the workers.
The minimum number of samples needed to estimate the mean value of the quartz
exposure can be calculated using the following formula [20]:
1 s
Z 1 a
2
N ¼ 2 (12.2)
d
where s is the population standard deviation; For a 90% confidence interval a ¼ 0.10
and Z 0.950 ¼ 1.645; N is the minimum number of samples needed; and the confidence
interval is 2d.
The data in Table 12.8 were analyzed using the above formula, and the minimum
number of samples needed to obtain a quartz percentage within plus or minus 20% of
the true mean value was determined. The results are shown in Table 12.9. The number