
Page 267 - Advanced Mine Ventilation
P. 267
244 Advanced Mine Ventilation
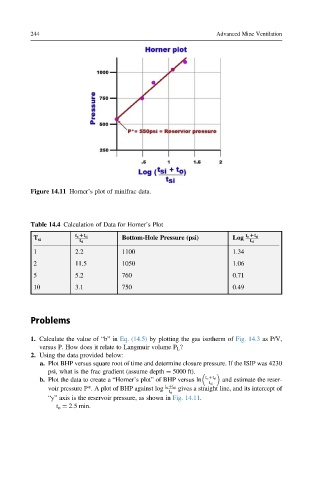
Figure 14.11 Horner’s plot of minifrac data.
Table 14.4 Calculation of Data for Horner’s Plot
t o Dt si
Bottom-Hole Pressure (psi) Log t o Dt si
T si
t si
t si
1 2.2 1100 1.34
2 11.5 1050 1.06
5 5.2 760 0.71
10 3.1 750 0.49
Problems
1. Calculate the value of “b” in Eq. (14.5) by plotting the gas isotherm of Fig. 14.3 as P/V,
versus P. How does it relate to Langmuir volume P L ?
2. Using the data provided below:
a. Plot BHP versus square root of time and determine closure pressure. If the ISIP was 4230
psi, what is the frac gradient (assume depth ¼ 5000 ft).
b. Plot the data to create a “Horner’s plot” of BHP versus ln t o þt si and estimate the reser-
t si
voir pressure P*. A plot of BHP against log t o þt si gives a straight line, and its intercept of
t si
“y” axis is the reservoir pressure, as shown in Fig. 14.11.
t o ¼ 2.5 min.