
Page 95 - Advanced Mine Ventilation
P. 95
76 Advanced Mine Ventilation
Table 5.2 Input Data Listing for a Working Minedcont’d
The Following Results Are for Carbon Monoxide Card 128
1 Card 129
50.0 6 Card 130
18 0.04 Card 131
31 0.08 Card 132
32 0.08 Card 133
40 0.16 Card 134
81 0.16 Card 135
116 0.16 Card 136
Card 137
Card 138
Card 139
Card 140
/* Card 141
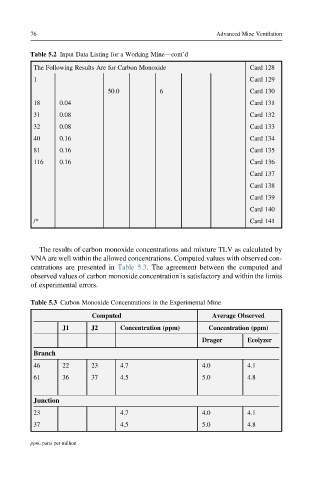
The results of carbon monoxide concentrations and mixture TLV as calculated by
VNA are well within the allowed concentrations. Computed values with observed con-
centrations are presented in Table 5.3. The agreement between the computed and
observed values of carbon monoxide concentration is satisfactory and within the limits
of experimental errors.
Table 5.3 Carbon Monoxide Concentrations in the Experimental Mine
Computed Average Observed
J1 J2 Concentration (ppm) Concentration (ppm)
Drager Ecolyzer
Branch
46 22 23 4.7 4.0 4.1
61 36 37 4.5 5.0 4.8
Junction
23 4.7 4.0 4.1
37 4.5 5.0 4.8
ppm, parts per million