
Page 250 - Advances in Biomechanics and Tissue Regeneration
P. 250
246 12. BIOMECHANICAL STUDY IN THE CALCANEUS BONE AFTER AN AUTOLOGOUS BONE HARVEST
12.3.2 Displacements Varying Achilles Tendon Load Based on the Amount of Bone Extraction
There was no change in either AP or ML translation in calcaneus with increasing Achilles tendon load based on the
amount of bone extraction (Table 12.3). There was, however, an increase in translation across conditions as the load on
the Achilles tendon increased.
Maximum principle stresses (tension) were concentrated at the posterior aspect of the calcaneus (Table 12.3;
Fig. 12.4). However, as the volume of bone removal increased and the load on the calcaneus increased in both the intact
model and models with bone removal, we observed that maximum principal stresses were concentrated around the
region of the extracted bone (Fig. 12.3).
Minimum principal stress (compression) was concentrated at the support zone (Table 12.2; Fig. 12.4). When the load
on the talus and the volume of bone extraction increased, compression stress in the healthy model and the simulated
model with removal of bone material extended from the edge of the bone extracted site to the bottom and sides of the
calcaneus, near the support zone planting (Fig. 12.4).
Principal stresses varying by the Achilles tendon load (Table 12.4; Figs. 12.5 and 12.6).
12.4 DISCUSSION
We used a 3-D FE model to create sequential simulations of calcaneus bone removal to mimic a graft harvest. The
3
size of the maximum donor site was 1.30cm . Based on our results, we suggest that a calcaneal bone harvest should not
exceed a volume of 2.4 0.7 0.75cm.
Because we were interested in evaluating the mechanical properties of the calcaneus during functional tasks, we
focused on the stance phase of gait, when the heel is on the ground. We also evaluated experimental conditions that
mimicked daily tasks and had the potential to increase calcaneal stress, including conditions with an increase in force
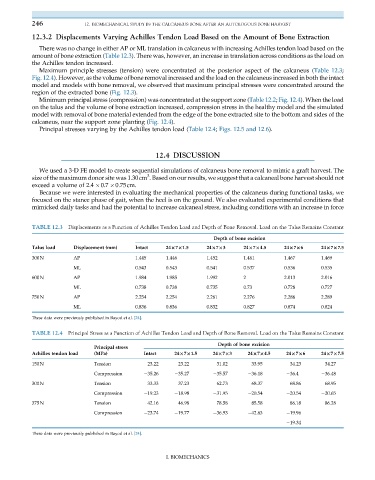
TABLE 12.3 Displacements as a Function of Achilles Tendon Load and Depth of Bone Removal. Load on the Talus Remains Constant
Depth of bone excision
Talus load Displacement (mm) Intact 24×7×1.5 24×7×3 24×7×4.5 24×7×6 24×7×7.5
300N AP 1.445 1.446 1.452 1.461 1.467 1.469
ML 0.543 0.543 0.541 0.537 0.536 0.535
600N AP 1.984 1.985 1.992 2 2.013 2.016
ML 0.738 0.738 0.735 0.73 0.728 0.727
750N AP 2.254 2.254 2.261 2.276 2.286 2.289
ML 0.836 0.836 0.832 0.827 0.874 0.824
These data were previously published in Bayod et al. [24].
TABLE 12.4 Principal Stress as a Function of Achilles Tendon Load and Depth of Bone Removal. Load on the Talus Remains Constant
Depth of bone excision
Principal stress
Achilles tendon load (MPa) Intact 24×7×1.5 24×7×3 24×7×4.5 24×7×6 24×7×7.5
150N Tension 23.22 23.22 31.02 33.95 34.23 34.27
Compression 35.26 35.27 35.57 36.18 36.4 36.48
300N Tension 33.33 37.23 62.73 68.37 68.86 68.95
Compression 19.23 18.98 31.95 20.54 20.54 20.65
375N Tension 42.16 46.98 78.58 85.58 86.18 86.28
Compression 23.74 19.77 36.93 42.63 19.96
19.34
These data were previously published in Bayod et al. [24].
I. BIOMECHANICS