
Page 286 - Advances in Forensic Applications of Mass Spectrometry - Jehuda Yinon
P. 286
1522_book.fm Page 257 Thursday, November 13, 2003 9:58 AM
100 [2M+75] - 518.4
95
90
85
80
75
70
65
Relative abundance 55
60
50
45
40
[M+75] -
35
295.6
30
25
[2M+59] -
20
15 [M+59] - [2M+35] -
10 [M+45] - 370.6 502.4
280.6 311.0 478.4
5 266
0
200 250 300 350 400 450 500 550 600 650 700 750 800
m/z
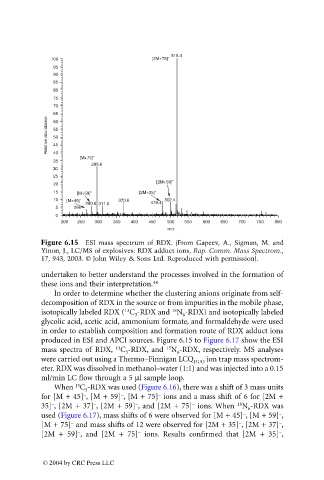
Figure 6.15 ESI mass spectrum of RDX. (From Gapeev, A., Sigman, M. and
Yinon, J., LC/MS of explosives: RDX adduct ions, Rap. Comm. Mass Spectrom.,
17, 943, 2003. © John Wiley & Sons Ltd. Reproduced with permission).
undertaken to better understand the processes involved in the formation of
these ions and their interpretation. 44
In order to determine whether the clustering anions originate from self-
decomposition of RDX in the source or from impurities in the mobile phase,
13
15
isotopically labeled RDX ( C -RDX and N -RDX) and isotopically labeled
6
3
glycolic acid, acetic acid, ammonium formate, and formaldehyde were used
in order to establish composition and formation route of RDX adduct ions
produced in ESI and APCI sources. Figure 6.15 to Figure 6.17 show the ESI
15
13
mass spectra of RDX, C -RDX, and N -RDX, respectively. MS analyses
3
6
were carried out using a Thermo–Finnigan LCQ DUO ion trap mass spectrom-
eter. RDX was dissolved in methanol–water (1:1) and was injected into a 0.15
ml/min LC flow through a 5 ml sample loop.
13
When C -RDX was used (Figure 6.16), there was a shift of 3 mass units
3
–
–
–
for [M + 45] , [M + 59] , [M + 75] ions and a mass shift of 6 for [2M +
–
–
–
15
–
35] , [2M + 37] , [2M + 59] , and [2M + 75] ions. When N -RDX was
6
–
–
used (Figure 6.17), mass shifts of 6 were observed for [M + 45] , [M + 59] ,
–
–
–
[M + 75] and mass shifts of 12 were observed for [2M + 35] , [2M + 37] ,
–
–
–
[2M + 59] , and [2M + 75] ions. Results confirmed that [2M + 35] ,
© 2004 by CRC Press LLC