
Page 244 - Aeronautical Engineer Data Book
P. 244
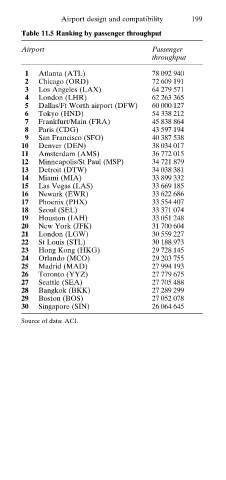
Airport design and compatibility   199
      Table 11.5 Ranking by passenger throughput
      Airport                      Passenger
                                   throughput
       1   Atlanta (ATL)           78 092 940
       2   Chicago (ORD)           72 609 191
       3   Los Angeles (LAX)       64 279 571
       4   London (LHR)            62 263 365
       5   Dallas/Ft Worth airport (DFW)   60 000 127
       6   Tokyo (HND)             54 338 212
       7   Frankfurt/Main (FRA)    45 838 864
       8   Paris (CDG)             43 597 194
       9   San Francisco (SFO)     40 387 538
      10   Denver (DEN)            38 034 017
      11   Amsterdam (AMS)         36 772 015
      12   Minneapolis/St Paul (MSP)   34 721 879
      13   Detroit (DTW)           34 038 381
      14   Miami (MIA)             33 899 332
      15   Las Vegas (LAS)         33 669 185
      16   Newark (EWR)            33 622 686
      17   Phoenix (PHX)           33 554 407
      18   Seoul (SEL)             33 371 074
      19   Houston (IAH)           33 051 248
      20   New York (JFK)          31 700 604
      21   London (LGW)            30 559 227
      22   St Louis (STL)          30 188 973
      23   Hong Kong (HKG)         29 728 145
      24   Orlando (MCO)           29 203 755
      25   Madrid (MAD)            27 994 193
      26   Toronto (YYZ)           27 779 675
      27   Seattle (SEA)           27 705 488
      28   Bangkok (BKK)           27 289 299
      29   Boston (BOS)            27 052 078
      30   Singapore (SIN)         26 064 645

      Source of data: ACI.