
Page 167 - Air Pollution Control Engineering
P. 167
03_chap_wang.qxd 05/05/2004 12:48 pm Page 146
146 José Renato Coury et al.
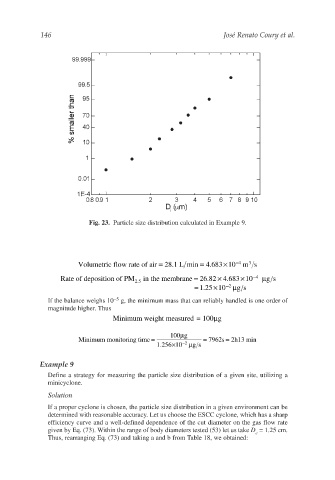
Fig. 23. Particle size distribution calculated in Example 9.
−
×
Volumetric flow rate of air = 28.1 L min = 4.683 10 m s
4
3
Rate of deposition of PM in the membrane = 26.82 4.683 10 g s
µ
×
−
×
4
2.5
×
−
1.25 10 µ g s
=
2
If the balance weighs 10 −5 g, the minimum mass that can reliably handled is one order of
magnitude higher. Thus
µ
Minimum weight measured = 100 g
µ
Minimum monitoring time = 100 g = 7962s = 2h13 min
−
1.256 10 µ g s
×
2
Example 9
Define a strategy for measuring the particle size distribution of a given site, utilizing a
minicyclone.
Solution
If a proper cyclone is chosen, the particle size distribution in a given environment can be
determined with reasonable accuracy. Let us choose the ESCC cyclone, which has a sharp
efficiency curve and a well-defined dependence of the cut diameter on the gas flow rate
given by Eq. (73). Within the range of body diameters tested (53) let us take D = 1.25 cm.
c
Thus, rearranging Eq. (73) and taking a and b from Table 18, we obtained: