
Page 162 - Air Pollution Control Engineering
P. 162
03_chap_wang.qxd 05/05/2004 12:48 pm Page 141
Cyclones 141
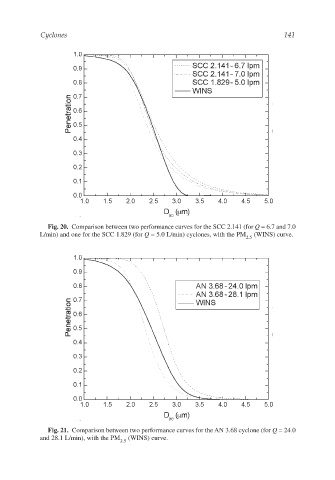
Fig. 20. Comparison between two performance curves for the SCC 2.141 (for Q = 6.7 and 7.0
L/min) and one for the SCC 1.829 (for Q = 5.0 L/min) cyclones, with the PM (WINS) curve.
2.5
Fig. 21. Comparison between two performance curves for the AN 3.68 cyclone (for Q = 24.0
and 28.1 L/min), with the PM (WINS) curve.
2.5