Page 160 - Air Pollution Control Engineering
P. 160

03_chap_wang.qxd  05/05/2004  12:48 pm  Page 139
                    Cyclones                                                                  139


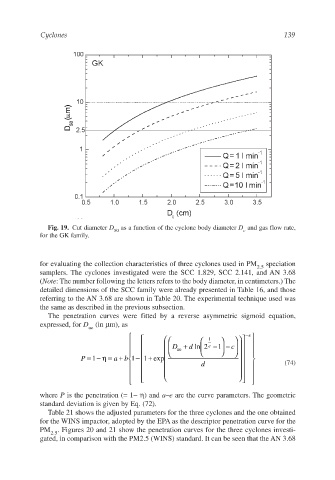
                       Fig. 19. Cut diameter D  as a function of the cyclone body diameter D and gas flow rate,
                                          50                                     c
                    for the GK family.


                    for evaluating the collection characteristics of three cyclones used in PM  speciation
                                                                                     2.5
                    samplers. The cyclones investigated were the SCC 1.829, SCC 2.141, and AN 3.68
                    (Note: The number following the letters refers to the body diameter, in centimeters.) The
                    detailed dimensions of the SCC family were already presented in Table 16, and those
                    referring to the AN 3.68 are shown in Table 20. The experimental technique used was
                    the same as described in the previous subsection.
                       The penetration curves were fitted by a reverse asymmetric sigmoid equation,
                    expressed, for D (in µm), as
                                   ae
                                                                   1          − e 
                                                          D +       e     −    
                                                                    
                                                             ae  d ln 2  −1    c    
                                                                    
                                                                                 
                                               
                                                     +
                                            +
                                 P =− η  =  a b  1 − 1 exp                     
                                                   
                                    1
                                                                                
                                                                  d                     (74)
                                                                              
                                                                               
                                                                                    
                                               
                    where P is the penetration (= 1−η) and a–e are the curve parameters. The geometric
                    standard deviation is given by Eq. (72).
                       Table 21 shows the adjusted parameters for the three cyclones and the one obtained
                    for the WINS impactor, adopted by the EPA as the descriptor penetration curve for the
                    PM . Figures 20 and 21 show the penetration curves for the three cyclones investi-
                       2.5
                    gated, in comparison with the PM2.5 (WINS) standard. It can be seen that the AN 3.68
   155   156   157   158   159   160   161   162   163   164   165