Page 161 - Air Pollution Control Engineering
P. 161

03_chap_wang.qxd  05/05/2004  12:48 pm  Page 140
                    140                                                    José Renato Coury et al.
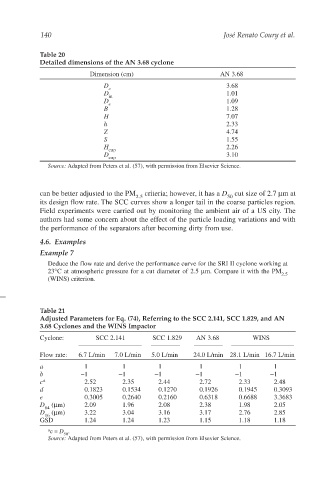
                    Table 20
                    Detailed dimensions of the AN 3.68 cyclone
                                   Dimension (cm)                         AN 3.68
                                       D                                    3.68
                                         c
                                       D                                    1.01
                                         in
                                       D                                    1.09
                                         e
                                       B                                    1.28
                                       H                                    7.07
                                       h                                    2.33
                                       Z                                    4.74
                                       S                                    1.55
                                       H                                    2.26
                                         cup
                                       D                                    3.10
                                         cup
                       Source: Adapted from Peters et al. (57), with permission from Elsevier Science.


                    can be better adjusted to the PM  criteria; however, it has a D  cut size of 2.7 µm at
                                                 2.5                        50
                    its design flow rate. The SCC curves show a longer tail in the coarse particles region.
                    Field experiments were carried out by monitoring the ambient air of a US city. The
                    authors had some concern about the effect of the particle loading variations and with
                    the performance of the separators after becoming dirty from use.
                    4.6. Examples
                    Example 7
                       Deduce the flow rate and derive the performance curve for the SRI II cyclone working at
                       23°C at atmospheric pressure for a cut diameter of 2.5 µm. Compare it with the PM
                                                                                             2.5
                       (WINS) criterion.


                    Table 21
                    Adjusted Parameters for Eq. (74), Referring to the SCC 2.141, SCC 1.829, and AN
                    3.68 Cyclones and the WINS Impactor
                    Cyclone:         SCC 2.141        SCC 1.829    AN 3.68          WINS


                    Flow rate:  6.7 L/min  7.0 L/min  5.0 L/min   24.0 L/min 28.1 L/min 16.7 L/min
                    a             1          1          1           1           1         1
                    b            −1         −1         −1          −1          −1        −1
                    c a           2.52       2.35       2.44        2.72        2.33      2.48
                    d             0.1823     0.1534     0.1270      0.1926      0.1945    0.3093
                    e             0.3005     0.2640     0.2160      0.6318      0.6688    3.3683
                    D   (µm)      2.09       1.96       2.08        2.38        1.98      2.05
                      84
                    D   (µm)      3.22       3.04       3.16        3.17        2.76      2.85
                      16
                    GSD           1.24       1.24       1.23        1.15        1.18      1.18
                       a c = D .
                           50
                       Source: Adapted from Peters et al. (57), with permission from Elsevier Science.
   156   157   158   159   160   161   162   163   164   165   166