Page 155 - Air Pollution Control Engineering
P. 155

03_chap_wang.qxd  05/05/2004  12:48 pm  Page 134
                    134                                                    José Renato Coury et al.


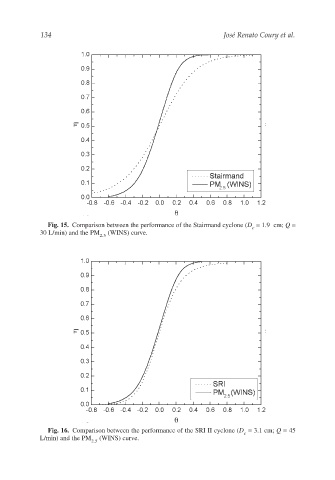
                       Fig. 15. Comparison between the performance of the Stairmand cyclone (D = 1.9  cm; Q =
                                                                                    c
                    30 L/min) and the PM  (WINS) curve.
                                      2.5


                       Fig. 16. Comparison between the performance of the SRI II cyclone (D = 3.1 cm; Q = 45
                                                                                 c
                    L/min) and the PM  (WINS) curve.
                                    2.5
   150   151   152   153   154   155   156   157   158   159   160