Page 153 - Air Pollution Control Engineering
P. 153

03_chap_wang.qxd  05/05/2004  12:48 pm  Page 132
                    132                                                    José Renato Coury et al.
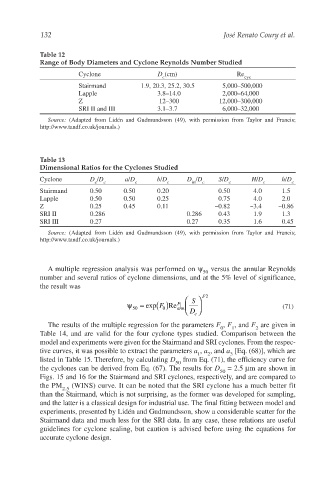
                    Table 12
                    Range of Body Diameters and Cyclone Reynolds Number Studied
                                Cyclone                 D (cm)                 Re
                                                         c                        cyc
                                Stairmand          1.9, 20.3, 25.2, 30.5   5,000–500,000
                                Lapple                  3.8–14.0           2,000–64,000
                                Z                       12–300            12,000–300,000
                                SRI II and III          3.1–3.7            6,000–32,000

                       Source: (Adapted from Lidén and Gudmundsson (49), with permission from  Taylor and Francis;
                    http://www.tandf.co.uk/journals.)


                    Table 13
                    Dimensional Ratios for the Cyclones Studied

                    Cyclone        D /D       a/D      b/D      D /D      S/D       H/D      h/D
                                     e  c        c        c       in  c      c         c        c
                    Stairmand      0.50      0.50      0.20               0.50      4.0      1.5
                    Lapple         0.50      0.50      0.25               0.75      4.0      2.0
                    Z              0.25      0.45      0.11              ~0.82     ~3.4     ~0.86
                    SRI II         0.286                        0.286     0.43      1.9      1.3
                    SRI III        0.27                         0.27      0.35      1.6      0.45
                       Source: (Adapted from Lidén and Gudmundsson (49), with permission from  Taylor and Francis;
                    http://www.tandf.co.uk/journals.)


                       Amultiple regression analysis was performed on ψ  versus the annular Reynolds
                                                                     50
                    number and several ratios of cyclone dimensions, and at the 5% level of significance,
                    the result was                                    2

                                              ψ   = exp( ) Re  F 1   S     F              (71)
                                                                
                                                        F
                                                             ann
                                                         0
                                                50
                                                                 D c 
                       The results of the multiple regression for the parameters F , F , and F are given in
                                                                          0   1      2
                    Table 14, and are valid for the four cyclone types studied. Comparison between the
                    model and experiments were given for the Stairmand and SRI cyclones. From the respec-
                    tive curves, it was possible to extract the parameters a , a , and a [Eq. (68)], which are
                                                                    1  2     3
                    listed in Table 15. Therefore, by calculating D  from Eq. (71), the efficiency curve for
                                                             50
                    the cyclones can be derived from Eq. (67). The results for D  = 2.5 µm are shown in
                                                                          50
                    Figs. 15 and 16 for the Stairmand and SRI cyclones, respectively, and are compared to
                    the PM    (WINS) curve. It can be noted that the SRI cyclone has a much better fit
                           2.5
                    than the Stairmand, which is not surprising, as the former was developed for sampling,
                    and the latter is a classical design for industrial use. The final fitting between model and
                    experiments, presented by Lidén and Gudmundsson, show a considerable scatter for the
                    Stairmand data and much less for the SRI data. In any case, these relations are useful
                    guidelines for cyclone scaling, but caution is advised before using the equations for
                    accurate cyclone design.
   148   149   150   151   152   153   154   155   156   157   158