
Page 148 - Air Pollution Control Engineering
P. 148
03_chap_wang.qxd 05/05/2004 12:48 pm Page 127
Cyclones 127
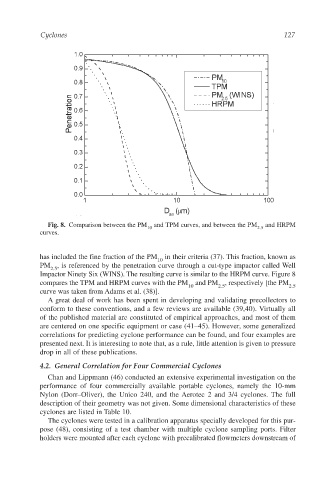
Fig. 8. Comparison between the PM and TPM curves, and between the PM and HRPM
10 2.5
curves.
has included the fine fraction of the PM in their criteria (37). This fraction, known as
10
PM , is referenced by the penetration curve through a cut-type impactor called Well
2.5
Impactor Ninety Six (WINS). The resulting curve is similar to the HRPM curve. Figure 8
compares the TPM and HRPM curves with the PM and PM , respectively [the PM
10 2.5 2.5
curve was taken from Adams et al. (38)].
A great deal of work has been spent in developing and validating precollectors to
conform to these conventions, and a few reviews are available (39,40). Virtually all
of the published material are constituted of empirical approaches, and most of them
are centered on one specific equipment or case (41–45). However, some generalized
correlations for predicting cyclone performance can be found, and four examples are
presented next. It is interesting to note that, as a rule, little attention is given to pressure
drop in all of these publications.
4.2. General Correlation for Four Commercial Cyclones
Chan and Lippmann (46) conducted an extensive experimental investigation on the
performance of four commercially available portable cyclones, namely the 10-mm
Nylon (Dorr–Oliver), the Unico 240, and the Aerotec 2 and 3/4 cyclones. The full
description of their geometry was not given. Some dimensional characteristics of these
cyclones are listed in Table 10.
The cyclones were tested in a calibration apparatus specially developed for this pur-
pose (48), consisting of a test chamber with multiple cyclone sampling ports. Filter
holders were mounted after each cyclone with precalibrated flowmeters downstream of