
Page 149 - Air Pollution Control Engineering
P. 149
03_chap_wang.qxd 05/05/2004 12:48 pm Page 128
128 José Renato Coury et al.
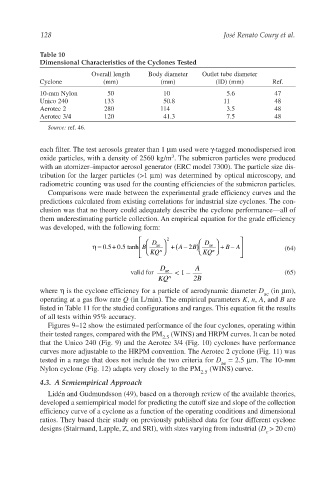
Table 10
Dimensional Characteristics of the Cyclones Tested
Overall length Body diameter Outlet tube diameter
Cyclone (mm) (mm) (ID) (mm) Ref.
10-mm Nylon 50 10 5.6 47
Unico 240 133 50.8 11 48
Aerotec 2 280 114 3.5 48
Aerotec 3/4 120 41.3 7.5 48
Source: ref. 46.
each filter. The test aerosols greater than 1 µm used were γ-tagged monodispersed iron
3
oxide particles, with a density of 2560 kg/m . The submicron particles were produced
with an atomizer–impactor aerosol generator (ERC model 7300). The particle size dis-
tribution for the larger particles (>1 µm) was determined by optical microscopy, and
radiometric counting was used for the counting efficiencies of the submicron particles.
Comparisons were made between the experimental grade efficiency curves and the
predictions calculated from existing correlations for industrial size cyclones. The con-
clusion was that no theory could adequately describe the cyclone performance—all of
them underestimating particle collection. An empirical equation for the grade efficiency
was developed, with the following form:
D 2 D
+
−
η= 0.5 0.5 tanh B ae +(A − 2B ) ae + BA (64)
KQ n KQ n
D ae A
1
valid for <− (65)
KQ n 2B
where η is the cyclone efficiency for a particle of aerodynamic diameter D (in µm),
ae
operating at a gas flow rate Q (in L/min). The empirical parameters K, n, A, and B are
listed in Table 11 for the studied configurations and ranges. This equation fit the results
of all tests within 95% accuracy.
Figures 9–12 show the estimated performance of the four cyclones, operating within
their tested ranges, compared with the PM (WINS) and HRPM curves. It can be noted
2.5
that the Unico 240 (Fig. 9) and the Aerotec 3/4 (Fig. 10) cyclones have performance
curves more adjustable to the HRPM convention. The Aerotec 2 cyclone (Fig. 11) was
tested in a range that does not include the two criteria for D = 2.5 µm. The 10-mm
ae
Nylon cyclone (Fig. 12) adapts very closely to the PM (WINS) curve.
2.5
4.3. A Semiempirical Approach
Lidén and Gudmundsson (49), based on a thorough review of the available theories,
developed a semiempirical model for predicting the cutoff size and slope of the collection
efficiency curve of a cyclone as a function of the operating conditions and dimensional
ratios. They based their study on previously published data for four different cyclone
designs (Stairmand, Lapple, Z, and SRI), with sizes varying from industrial (D > 20 cm)
c