
Page 24 - Air Pollution Control Engineering
P. 24
01_chap_wang.qxd 05/05/2004 11:45 am Page 5
Air Quality and Pollution Control 5
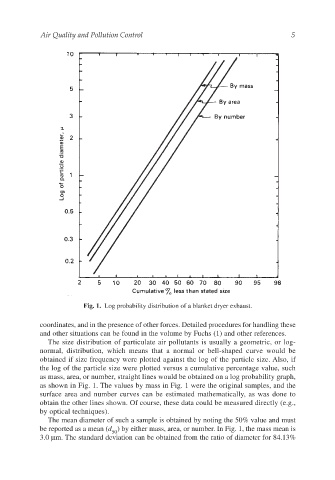
Fig. 1. Log probability distribution of a blanket dryer exhaust.
coordinates, and in the presence of other forces. Detailed procedures for handling these
and other situations can be found in the volume by Fuchs (1) and other references.
The size distribution of particulate air pollutants is usually a geometric, or log-
normal, distribution, which means that a normal or bell-shaped curve would be
obtained if size frequency were plotted against the log of the particle size. Also, if
the log of the particle size were plotted versus a cumulative percentage value, such
as mass, area, or number, straight lines would be obtained on a log probability graph,
as shown in Fig. 1. The values by mass in Fig. 1 were the original samples, and the
surface area and number curves can be estimated mathematically, as was done to
obtain the other lines shown. Of course, these data could be measured directly (e.g.,
by optical techniques).
The mean diameter of such a sample is obtained by noting the 50% value and must
be reported as a mean (d ) by either mass, area, or number. In Fig. 1, the mass mean is
50
3.0 µm. The standard deviation can be obtained from the ratio of diameter for 84.13%