
Page 31 - Air Pollution Control Engineering
P. 31
01_chap_wang.qxd 05/05/2004 11:45 am Page 11
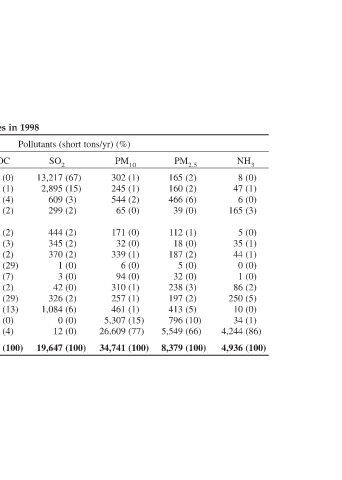
NH 3 8 (0) 47 (1) 6 (0) 165 (3) 5 (0) 35 (1) 44 (1) 0 (0) 1 (0) 86 (2) 250 (5) 10 (0) 34 (1) 4,244 (86) 4,936 (100)
PM 2.5 165 (2) 160 (2) 466 (6) 39 (0) 112 (1) 18 (0) 187 (2) 5 (0) 32 (0) 238 (3) 197 (2) 413 (5) 796 (10) 5,549 (66) 8,379 (100)
Pollutants (short tons/yr) (%) PM 10 SO 2 302 (1) 13,217 (67) 245 (1) 2,895 (15) 544 (2) 609 (3) 65 (0) 299 (2) 171 (0) 444 (2) 32 (0) 345 (2) 339 (1) 370 (2) 6 (0) 1 (0) 94 (0) 3 (0) 310 (1) 42 (0) 257 (1) 326 (2) 461 (1) 1,084 (6) 5,307 (15) 0 (0) 26,609 (77) 12 (0) 34,741 (100) 19,647 (100)
Estimated Summary of Air Pollutant Emission in the United States in 1998
VOC 54 (0) 161 (1) 678 (4) 396 (2) 76 (2) 496 (3) 450 (2) 5,278 (29) 1,324 (7) 433 (2) 5,325 (29) 2,461 (13) 14 (0) 772 (4) 17,917 (100)
6,103 (25) 2,969 (12) 152 (1) 88 (0) 138 (1) 408 (2) 2 (0) 7 (0) 97 (0) 7,765 (32) 5,280 (22) 0 (0) 328 (1)
NO x 1,117 (5) 24,454 (100)
417 (0) 368 (0) 632 (1) 2 (0) 80 (0) 0 (0) 8,920 (10)
CO 1,114 (1) 3,843 (4) 1,129 (1) 1,495 (2) 1,154 (1) 50,386 (56) 19,914 (22) 89,454 (100)
Table 2 Source category Fuel combustion, elec. util. Fuel combustion, industrial Fuel combustion, other Chemical and allied product Manufacturing Metals processing Petroleum and related industries Other industrial processes Solvent utilization Storage and transport Waste disposal and recycling Highway vehicles Off-highway vehicles Natural sources Miscellaneous
11