
Page 138 - Air pollution and greenhouse gases from basic concepts to engineering applications for air emission control
P. 138
112 4 Properties of Aerosol Particles
99.99
99.95
99.9
99.8
99 Number
Cumulative % Less Than Indicated Size 50 80 Mass
98
95
distribution line
90
70
60
40
34
distribution line
30
20
10
5
2
1
0.5
0.2
0.1
0.0
0.01
0 1 10 100
Count median Standard deviation Mass median
diameter
diameter
Particle Diameter (µm)
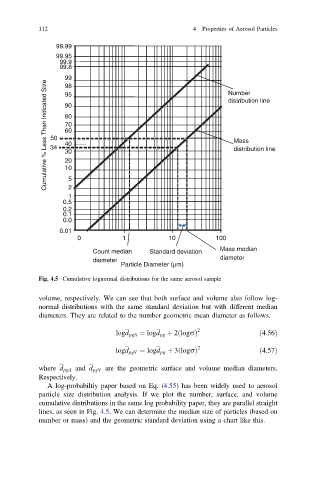
Fig. 4.5 Cumulative lognormal distributions for the same aerosol sample
volume, respectively. We can see that both surface and volume also follow log-
normal distributions with the same standard deviation but with different median
diameters. They are related to the number geometric mean diameter as follows.
2
logd pgA ¼ logd pg þ 2 logrð Þ ð4:56Þ
2
logd pgV ¼ logd pg þ 3 logrð Þ ð4:57Þ
where d pgA and d pgV are the geometric surface and volume median diameters.
Respectively.
A log-probabiltiy paper based on Eq. (4.55) has been widely used to aerosol
particle size distribution analysis. If we plot the number, surface, and volume
cumulative distributions in the same log probability paper, they are parallel straight
lines, as seen in Fig. 4.5. We can determine the median size of particles (based on
number or mass) and the geometric standard deviation using a chart like this.