
Page 338 - Air pollution and greenhouse gases from basic concepts to engineering applications for air emission control
P. 338
316 11 Air Dispersion
these boxes is well mixed in the calculation domain, and moving along one
dimension that is perpendicular to the inlet surfaces.
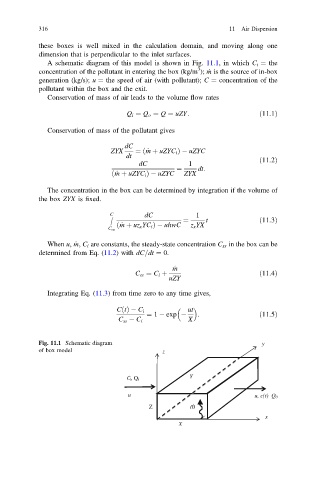
A schematic diagram of this model is shown in Fig. 11.1, in which C i ¼ the
3
concentration of the pollutant in entering the box (kg/m ); ṁ is the source of in-box
generation (kg/s); u ¼ the speed of air (with pollutant); C ¼ concentration of the
pollutant within the box and the exit.
Conservation of mass of air leads to the volume flow rates
Q i ¼ Q o ¼ Q ¼ uZY: ð11:1Þ
Conservation of mass of the pollutant gives
dC
ZYX ¼ _ m þ uZYC i Þ uZYC
ð
dt
dC 1 ð11:2Þ
¼ dt:
ð _ m þ uZYC i Þ uZYC ZYX
The concentration in the box can be determined by integration if the volume of
the box ZYX is fixed.
Z C dC 1
¼ t ð11:3Þ
ð _ m þ uz x YC i Þ uhwC z x YX
C 1
When u, _ m; C i are constants, the steady-state concentration C ss in the box can be
determined from Eq. (11.2) with dC=dt ¼ 0.
_ m
C ss ¼ C i þ ð11:4Þ
uZY
Integrating Eq. (11.3) from time zero to any time gives,
ut
CðtÞ C i
¼ 1 exp : ð11:5Þ
C ss C i X
Fig. 11.1 Schematic diagram y
of box model z
Y
i , Q i
u u, c(t) Q 0
Z
x
X