
Page 339 - Air pollution and greenhouse gases from basic concepts to engineering applications for air emission control
P. 339
11.1 Box Model 317
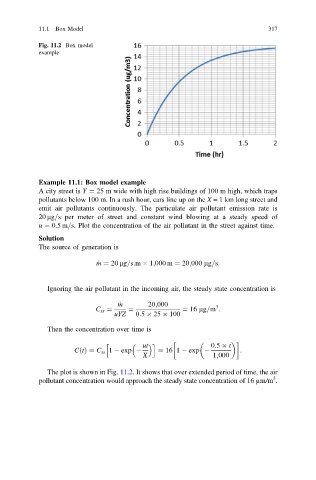
Fig. 11.2 Box model
example
Example 11.1: Box model example
A city street is Y ¼ 25 m wide with high rise buildings of 100 m high, which traps
pollutants below 100 m. In a rush hour, cars line up on the X = 1 km long street and
emit air pollutants continuously. The particulate air pollutant emission rate is
20 lg=s per meter of street and constant wind blowing at a steady speed of
u ¼ 0:5m=s. Plot the concentration of the air pollutant in the street against time.
Solution
The source of generation is
_ m ¼ 20 lg=s:m 1;000 m ¼ 20;000 lg=s:
Ignoring the air pollutant in the incoming air, the steady state concentration is
_ m 20;000 3
C ss ¼ ¼ ¼ 16 lg=m :
uYZ 0:5 25 100
Then the concentration over time is
ut 0:5 t
h i
CðtÞ¼ C ss 1 exp ¼ 16 1 exp :
X 1;000
The plot is shown in Fig. 11.2. It shows that over extended period of time, the air
3
pollutant concentration would approach the steady state concentration of 16 µm/m .