
Page 183 - Alternative Energy Systems in Building Design
P. 183
INCENTIVE PAYMENT STRUCTURE 159
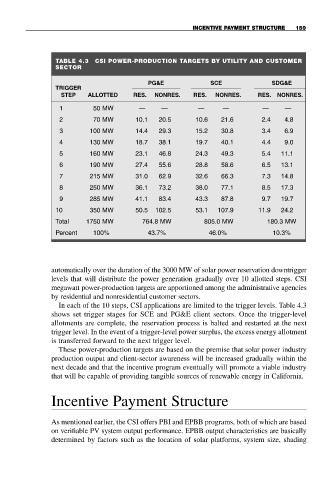
TABLE 4.3 CSI POWER-PRODUCTION TARGETS BY UTILITY AND CUSTOMER
SECTOR
PG&E SCE SDG&E
TRIGGER
STEP ALLOTTED RES. NONRES. RES. NONRES. RES. NONRES.
1 50 MW — — — — — —
2 70 MW 10.1 20.5 10.6 21.6 2.4 4.8
3 100 MW 14.4 29.3 15.2 30.8 3.4 6.9
4 130 MW 18.7 38.1 19.7 40.1 4.4 9.0
5 160 MW 23.1 46.8 24.3 49.3 5.4 11.1
6 190 MW 27.4 55.6 28.8 58.6 6.5 13.1
7 215 MW 31.0 62.9 32.6 66.3 7.3 14.8
8 250 MW 36.1 73.2 38.0 77.1 8.5 17.3
9 285 MW 41.1 83.4 43.3 87.8 9.7 19.7
10 350 MW 50.5 102.5 53.1 107.9 11.9 24.2
Total 1750 MW 764.8 MW 805.0 MW 180.3 MW
Percent 100% 43.7% 46.0% 10.3%
automatically over the duration of the 3000 MW of solar power reservation downtrigger
levels that will distribute the power generation gradually over 10 allotted steps. CSI
megawatt power-production targets are apportioned among the administrative agencies
by residential and nonresidential customer sectors.
In each of the 10 steps, CSI applications are limited to the trigger levels. Table 4.3
shows set trigger stages for SCE and PG&E client sectors. Once the trigger-level
allotments are complete, the reservation process is halted and restarted at the next
trigger level. In the event of a trigger-level power surplus, the excess energy allotment
is transferred forward to the next trigger level.
These power-production targets are based on the premise that solar power industry
production output and client-sector awareness will be increased gradually within the
next decade and that the incentive program eventually will promote a viable industry
that will be capable of providing tangible sources of renewable energy in California.
Incentive Payment Structure
As mentioned earlier, the CSI offers PBI and EPBB programs, both of which are based
on verifiable PV system output performance. EPBB output characteristics are basically
determined by factors such as the location of solar platforms, system size, shading