
Page 23 - An Introduction to Analytical Atomic Spectrometry - L. Ebdon
P. 23
Page 8
1.4 Practice
1.4.1 Calibration and Analysis
Spectroscopic techniques require calibration with standards of known analyte concentration. Atomic
spectrometry is sufficiently specific for a simple solution of a salt of the analyte in dilute acid to be
used, although it is a wise precaution to buffer the standards with any salt which occurs in large
concentration in the sample solution, e.g. 500 µg ml or above. Calibration curves can be obtained by
-1
plotting absorbance (for AAS), emission signal (for AES), fluorescence signal (for AFS) or ion count
rate (for MS) as the dependent variable against concentration as the independent variable. Often the
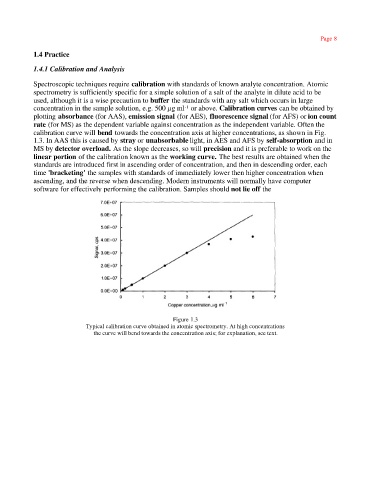
calibration curve will bend towards the concentration axis at higher concentrations, as shown in Fig.
1.3. In AAS this is caused by stray or unabsorbable light, in AES and AFS by self-absorption and in
MS by detector overload. As the slope decreases, so will precision and it is preferable to work on the
linear portion of the calibration known as the working curve. The best results are obtained when the
standards are introduced first in ascending order of concentration, and then in descending order, each
time 'bracketing' the samples with standards of immediately lower then higher concentration when
ascending, and the reverse when descending. Modern instruments will normally have computer
software for effectively performing the calibration. Samples should not lie off the
Figure 1.3
Typical calibration curve obtained in atomic spectrometry. At high concentrations
the curve will bend towards the concentration axis; for explanation, see text.