
Page 140 -
P. 140
120 CHAPTER 3 LINEAR PROGRAMMING: SENSITIVITY ANALYSIS AND INTERPRETATION OF SOLUTION
indicates that total profit will fall by $17. In other words, relaxing this constraint (say
to 149 units) will actually be beneficial to profit. Management may, therefore, wish
to re-consider their commitment to selling through retail stores.
It is worth re-emphasizing the importance of sensitivity analysis,or post-
optimality analysis. The information provided through such analysis allows us to
answer a considerable number of what-if questions about the current problem
and its optimal solution without further calculation or solution. If we know what
we are doing, we can provide management with information about the effects of
changes in any of the objective function coefficients and on changes in the right-
hand side of each of the problem constraints. This allows management to
consider the effects of any assumptions built into the existing model and to
consider management actions that may lead to an ever better solution to the
problem under consideration.
Again, the sensitivity analysis or post-optimality analysis provided by computer
software packages for linear programming problems considers only one change at a
time, with all other coefficients of the problem remaining as originally specified. As
mentioned earlier, simultaneous changes can sometimes be analyzed without re-
solving the problem, provided that the cumulative changes are not large enough to
violate the 100 per cent rule.
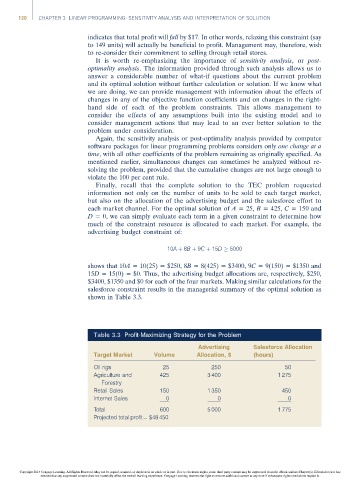
Finally, recall that the complete solution to the TEC problem requested
information not only on the number of units to be sold to each target market,
but also on the allocation of the advertising budget and the salesforce effort to
each market channel. For the optimal solution of A = 25, B = 425, C = 150 and
D = 0, we can simply evaluate each term in a given constraint to determine how
much of the constraint resource is allocated to each market. For example, the
advertising budget constraint of:
10A þ 8B þ 9C þ 15D 5000
shows that 10A = 10(25) = $250, 8B = 8(425) = $3400, 9C = 9(150) = $1350 and
15D = 15(0) = $0. Thus, the advertising budget allocations are, respectively, $250,
$3400, $1350 and $0 for each of the four markets. Making similar calculations for the
salesforce constraint results in the managerial summary of the optimal solution as
shown in Table 3.3.
Table 3.3 Profit-Maximizing Strategy for the Problem
Advertising Salesforce Allocation
Target Market Volume Allocation, $ (hours)
Oil rigs 25 250 50
Agriculture and 425 3 400 1 275
Forestry
Retail Sales 150 1 350 450
Internet Sales 0 0 0
Total 600 5 000 1 775
Projected total profit= $48 450
Copyright 2014 Cengage Learning. All Rights Reserved. May not be copied, scanned, or duplicated, in whole or in part. Due to electronic rights, some third party content may be suppressed from the eBook and/or eChapter(s). Editorial review has
deemed that any suppressed content does not materially affect the overall learning experience. Cengage Learning reserves the right to remove additional content at any time if subsequent rights restrictions require it.