
Page 205 -
P. 205
DATA ENVELOPMENT ANALYSIS 185
DEA was first proposed region of the country: the General, the University, the County and the City hospitals.
by Charnes, Cooper and The data show a number of variables for each hospital:
Rhodes in 1978
l Full time equivalent (FTE) staff: the total number of full-time equivalent staff
working in each hospital.
l Supply costs: the costs, in E000s, of running each hospital each year. Such costs
will be made up of the cost of drugs and medicines as well as routine
operational costs such as heating, maintenance, cleaning, etc.
l Bed days available: this measures the hospital’s capacity to provide health care
and measures the number of beds available multiplied by the number of days
in the year each bed was available. For example, with ten beds available for,
say, 350 days in the year we would have 3500 bed days available.
l Number of in-patient days treatment provided: an in-patient is someone
admitted to hospital for health treatment. This variable measures the total
number of days that in-patients were being treated at the hospital. For
example, if we had 20 in-patients each staying five days in the hospital for
treatment then the number of in-patient days provided would be 100.
l Out-patients treated: an out-patient is someone requiring medical treatment but
who does not need to be admitted into the hospital. They can be treated at the
hospital and leave the same day.
l Nurses trained: the number of people who have completed a formal nurse
training programme at the hospital.
l Paramedics trained: the number of people who have completed a formal
paramedic training programme at the hospital.
One aspect that hospital management is likely to be interested in is relative performance.
How is an individual hospital performing in comparison with the others? Whilst there are a
number of different ways we could approach such an investigation into efficiency the one
we shall explore utilizes features of the basic LP model. We can actually view the informa-
tioninthetableasasetofinputsandasetofoutputs.Simply,inputsaretheresourcesgoing
into a hospital so it can produce certain outputs. So, in the case of the hospitals, we have
FTE staff, supply costs and available bed days as the inputs – the resources used by the
hospitals. These resources are needed in order to produce outputs – here to provide
treatment and care to patients in the form of in-patient days and out-patients treated;
and to provide training to nurses and paramedics. Now, in terms of efficiency, other things
being equal we would like to get the most outputs from the least inputs and we would be
interested in seeing how the four hospitals are doing in terms of efficiency in relation to
each other.
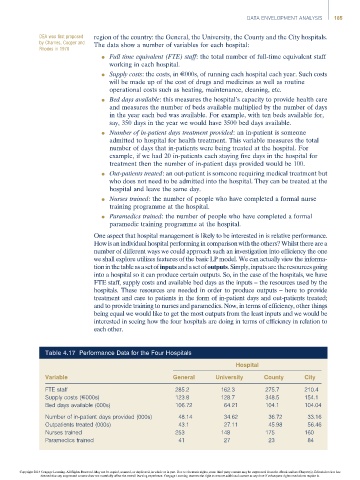
Table 4.17 Performance Data for the Four Hospitals
Hospital
Variable General University County City
FTE staff 285.2 162.3 275.7 210.4
Supply costs (E000s) 123.8 128.7 348.5 154.1
Bed days available (000s) 106.72 64.21 104.1 104.04
Number of in-patient days provided (000s) 48.14 34.62 36.72 33.16
Outpatients treated (000s) 43.1 27.11 45.98 56.46
Nurses trained 253 148 175 160
Paramedics trained 41 27 23 84
Copyright 2014 Cengage Learning. All Rights Reserved. May not be copied, scanned, or duplicated, in whole or in part. Due to electronic rights, some third party content may be suppressed from the eBook and/or eChapter(s). Editorial review has
deemed that any suppressed content does not materially affect the overall learning experience. Cengage Learning reserves the right to remove additional content at any time if subsequent rights restrictions require it.