
Page 378 -
P. 378
358 CHAPTER 8 NETWORK MODELS
MANAGEMENT SCIENCE IN ACTION
EDS Designs a Communication Network
DS, headquartered in Plano, Texas, is a global EDS’s task was to span the network by finding
E leader in information technology services. The the most cost-effective way to link the 64 customer
company provides hardware, software, communica- locations with each other and with existing EDS data
tions and process solutions to many companies and centres. The arcs of the network represented com-
governments around the world. munication links between pairs of nodes in the net-
EDS designs communication systems and infor- work. In cases where land communication lines were
mation networks for many of its customers. In one available, the arcs consisted of fibre-optic telephone
application, an EDS customer wanted to link together lines. In other cases, the arcs represented satellite
64 locations for information flow and communications. communication connections.
Interactive transmission involving voice, video and dig- Using cost as the criterion, EDS developed the
ital data had to be accommodated in the information information network for the customer by solving a
flow between the various sites. The customer’s loca- minimal spanning tree problem. The minimum cost
tions included approximately 50 offices and informa- network design made it possible for all customer
tion centres in the continental United States; they locations to communicate with each other and with
ranged from Connecticut to Florida to Michigan to the existing EDS data centres.
Texas to California. Additional locations existed in Can-
The authors are indebted to Greg A. Dennis of EDS for providing this
ada, Mexico, Hawaii and Puerto Rico. A total of 64
application.
locations formed the nodes of the information network.
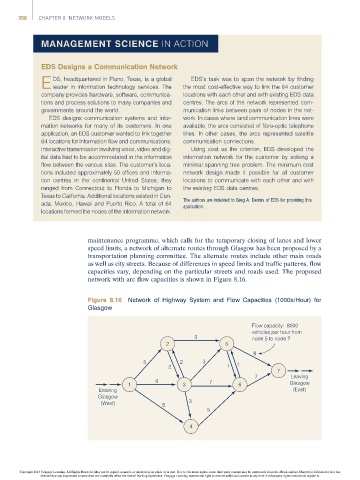
maintenance programme, which calls for the temporary closing of lanes and lower
speed limits, a network of alternate routes through Glasgow has been proposed by a
transportation planning committee. The alternate routes include other main roads
as well as city streets. Because of differences in speed limits and traffic patterns, flow
capacities vary, depending on the particular streets and roads used. The proposed
network with arc flow capacities is shown in Figure 8.16.
Figure 8.16 Network of Highway System and Flow Capacities (1000s/Hour) for
Glasgow
Flow capacity: 8000
vehicles per hour from
3 node 5 to node 7
2 5
8
5 2 3 1
2 1
7
7 Leaving
6 7
1 3 6 Glasgow
Entering (East)
Glasgow
(West) 5 3
5
4
Copyright 2014 Cengage Learning. All Rights Reserved. May not be copied, scanned, or duplicated, in whole or in part. Due to electronic rights, some third party content may be suppressed from the eBook and/or eChapter(s). Editorial review has
deemed that any suppressed content does not materially affect the overall learning experience. Cengage Learning reserves the right to remove additional content at any time if subsequent rights restrictions require it.