
Page 76 - Analysis and Design of Energy Geostructures
P. 76
46 Analysis and Design of Energy Geostructures
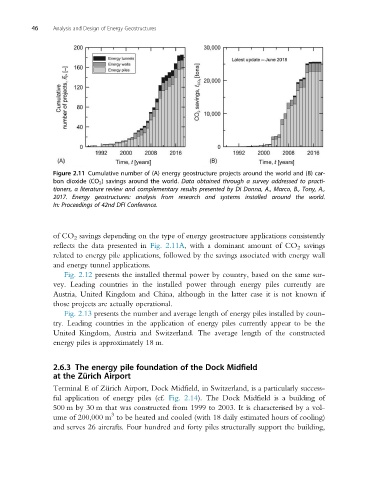
Figure 2.11 Cumulative number of (A) energy geostructure projects around the world and (B) car-
bon dioxide (CO 2 ) savings around the world. Data obtained through a survey addressed to practi-
tioners, a literature review and complementary results presented by Di Donna, A., Marco, B., Tony, A.,
2017. Energy geostructures: analysis from research and systems installed around the world.
In: Proceedings of 42nd DFI Conference.
of CO 2 savings depending on the type of energy geostructure applications consistently
reflects the data presented in Fig. 2.11A, with a dominant amount of CO 2 savings
related to energy pile applications, followed by the savings associated with energy wall
and energy tunnel applications.
Fig. 2.12 presents the installed thermal power by country, based on the same sur-
vey. Leading countries in the installed power through energy piles currently are
Austria, United Kingdom and China, although in the latter case it is not known if
those projects are actually operational.
Fig. 2.13 presents the number and average length of energy piles installed by coun-
try. Leading countries in the application of energy piles currently appear to be the
United Kingdom, Austria and Switzerland. The average length of the constructed
energy piles is approximately 18 m.
2.6.3 The energy pile foundation of the Dock Midfield
at the Zürich Airport
Terminal E of Zürich Airport, Dock Midfield, in Switzerland, is a particularly success-
ful application of energy piles (cf. Fig. 2.14). The Dock Midfield is a building of
500 m by 30 m that was constructed from 1999 to 2003. It is characterised by a vol-
3
ume of 200,000 m to be heated and cooled (with 18 daily estimated hours of cooling)
and serves 26 aircrafts. Four hundred and forty piles structurally support the building,