
Page 128 - Analysis, Synthesis and Design of Chemical Processes, Third Edition
P. 128
where m is the number of unit operations, N is the number of products, and nc is the number of campaigns
i
of product i produced in a single multiproduct sequence. For the case shown in Table 3.2 and Figure 3.7,
n =1 (because only one campaign for each product (A, B, and C) is used in the multiproduct sequence),
and Equation (3.8) is the maximum value given in the last row of Table 3.2, or 11.0 h.
The total amount of storage required for this example is fairly small, because only three storage vessels
are required, each dedicated to one intermediate product. The downside of this approach is that there are
many more material transfers required, and the potential for product contamination and operator error
increases significantly.
3.5.3 Parallel Process Units
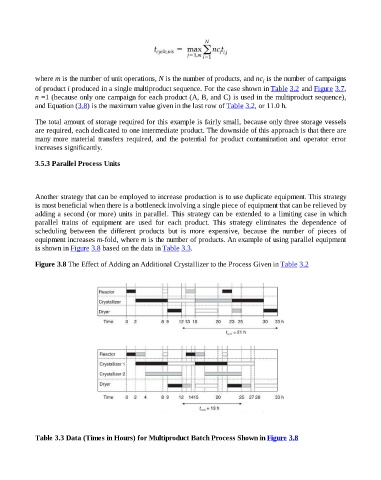
Another strategy that can be employed to increase production is to use duplicate equipment. This strategy
is most beneficial when there is a bottleneck involving a single piece of equipment that can be relieved by
adding a second (or more) units in parallel. This strategy can be extended to a limiting case in which
parallel trains of equipment are used for each product. This strategy eliminates the dependence of
scheduling between the different products but is more expensive, because the number of pieces of
equipment increases m-fold, where m is the number of products. An example of using parallel equipment
is shown in Figure 3.8 based on the data in Table 3.3.
Figure 3.8 The Effect of Adding an Additional Crystallizer to the Process Given in Table 3.2
Table 3.3 Data (Times in Hours) for Multiproduct Batch Process Shown in Figure 3.8