
Page 310 - Analysis, Synthesis and Design of Chemical Processes, Third Edition
P. 310
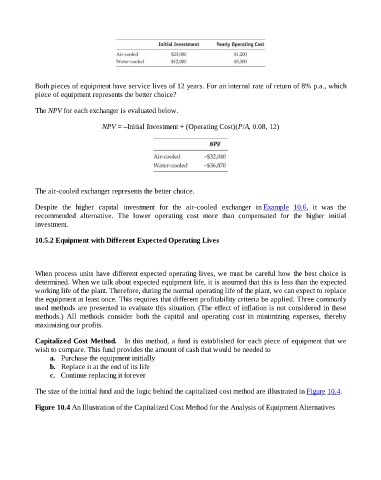
Both pieces of equipment have service lives of 12 years. For an internal rate of return of 8% p.a., which
                    piece of equipment represents the better choice?


                    The NPV for each exchanger is evaluated below.


                                              NPV = –Initial Investment + (Operating Cost)(P/A, 0.08, 12)


                    The air-cooled exchanger represents the better choice.

                    Despite  the  higher  capital  investment  for  the  air-cooled  exchanger  in Example  10.6,  it  was  the
                    recommended  alternative.  The  lower  operating  cost  more  than  compensated  for  the  higher  initial

                    investment.

                    10.5.2 Equipment with Different Expected Operating Lives


                    When process units have different expected operating lives, we must be careful how the best choice is
                    determined. When we talk about expected equipment life, it is assumed that this is less than the expected

                    working life of the plant. Therefore, during the normal operating life of the plant, we can expect to replace
                    the equipment at least once. This requires that different profitability criteria be applied. Three commonly
                    used methods are presented to evaluate this situation. (The effect of inflation is not considered in these
                    methods.)  All  methods  consider  both  the  capital  and  operating  cost  in  minimizing  expenses,  thereby
                    maximizing our profits.


                    Capitalized Cost Method.   In this method, a fund is established for each piece of equipment that we
                    wish to compare. This fund provides the amount of cash that would be needed to
                          a.   Purchase the equipment initially
                          b.   Replace it at the end of its life
                          c.   Continue replacing it forever


                    The size of the initial fund and the logic behind the capitalized cost method are illustrated in Figure 10.4.


                    Figure 10.4 An Illustration of the Capitalized Cost Method for the Analysis of Equipment Alternatives