
Page 149 - Analytical Electrochemistry 2d Ed - Jospeh Wang
P. 149
134 PRACTICAL CONSIDERATIONS
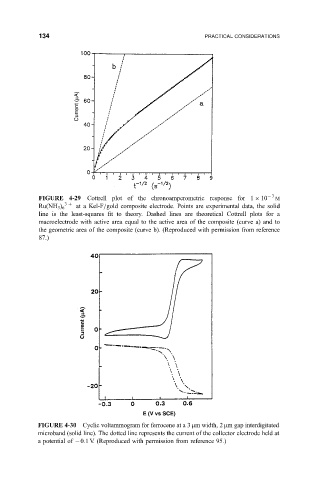
FIGURE 4-29 Cottrell plot of the chronoamperometric response for 1 10 3 M
3
Ru(NH 3 ) 6 at a Kel-F=gold composite electrode. Points are experimental data, the solid
line is the least-squares ®t to theory. Dashed lines are theoretical Cottrell plots for a
macroelectrode with active area equal to the active area of the composite (curve a) and to
the geometric area of the composite (curve b). (Reproduced with permission from reference
87.)
FIGURE 4-30 Cyclic voltammogram for ferrocene at a 3 mm width, 2 mm gap interdigitated
microband (solid line). The dotted line represents the current of the collector electrode held at
a potential of 0.1 V. (Reproduced with permission from reference 95.)