
Page 227 - Analytical method for food addtives
P. 227
150 Analytical methods for food additives
Reference 1,2 5 13 14 15
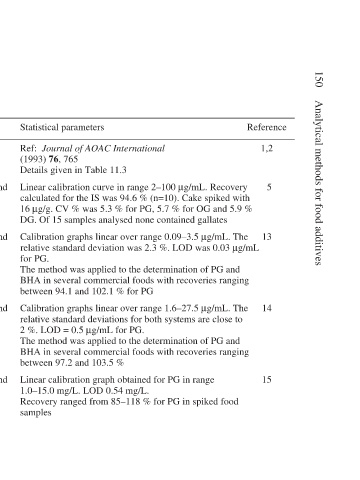
Statistical parameters Ref: Journal of AOAC International (1993) 76, 765 Details given in Table 11.3 Linear calibration curve in range 2–100 µg/mL. Recovery calculated for the IS was 94.6 % (n=10). Cake spiked with 16 µg/g. CV % was 5.3 % for PG, 5.7 % for OG and 5.9 % DG. Of 15 samples analysed none contained gallates Cali
Summary of statistical parameters for gallates in foods
Extent of validation AOAC Official Method 983.15 Full collaborative trial Precision of method established and applied to 15 commercial samples Precision of method established and applied to 10 commercial samples Precision of method established and applied to 8 commercial samples Precision of method established and applie
Matrix Oils, fats and butter oil Bakery products Foods Foods Foods
Table 11.2 Method LC HPLC Stopped flow mixing and a T-format luminescence spectrometer Stopped flow mixing and diode-array Voltammetric