
Page 148 - Anatomy of a Robot
P. 148
04_200256_CH04/Bergren 4/10/03 11:59 AM Page 133
RELIABILITY, SAFETY, AND COMPLIANCE 133
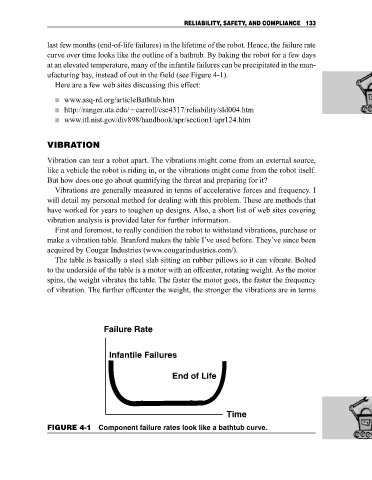
last few months (end-of-life failures) in the lifetime of the robot. Hence, the failure rate
curve over time looks like the outline of a bathtub. By baking the robot for a few days
at an elevated temperature, many of the infantile failures can be precipitated in the man-
ufacturing bay, instead of out in the field (see Figure 4-1).
Here are a few web sites discussing this effect:
www.asq-rd.org/articleBathtub.htm
http://ranger.uta.edu/ carroll/cse4317/reliability/sld004.htm
www.itl.nist.gov/div898/handbook/apr/section1/apr124.htm
VIBRATION
Vibration can tear a robot apart. The vibrations might come from an external source,
like a vehicle the robot is riding in, or the vibrations might come from the robot itself.
But how does one go about quantifying the threat and preparing for it?
Vibrations are generally measured in terms of accelerative forces and frequency. I
will detail my personal method for dealing with this problem. These are methods that
have worked for years to toughen up designs. Also, a short list of web sites covering
vibration analysis is provided later for further information.
First and foremost, to really condition the robot to withstand vibrations, purchase or
make a vibration table. Branford makes the table I’ve used before. They’ve since been
acquired by Cougar Industries (www.cougarindustries.com/).
The table is basically a steel slab sitting on rubber pillows so it can vibrate. Bolted
to the underside of the table is a motor with an offcenter, rotating weight. As the motor
spins, the weight vibrates the table. The faster the motor goes, the faster the frequency
of vibration. The further offcenter the weight, the stronger the vibrations are in terms
Failure Rate
Infantile Failures
End of Life
Time
FIGURE 4-1 Component failure rates look like a bathtub curve.