
Page 217 - Anatomy of a Robot
P. 217
08_200256_CH08/Bergren 4/10/03 4:39 PM Page 202
202 CHAPTER EIGHT
0.3
0.2
0.0 0.1 Perfect, Brick Wall Anti-alias Filter 0.5
0.4
0 db
-20 db
-40 db
-60 db
-80 db
-100 db
-120 db
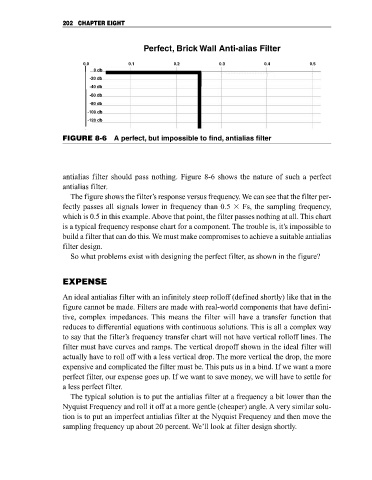
FIGURE 8-6 A perfect, but impossible to find, antialias filter
antialias filter should pass nothing. Figure 8-6 shows the nature of such a perfect
antialias filter.
The figure shows the filter’s response versus frequency. We can see that the filter per-
fectly passes all signals lower in frequency than 0.5 Fs, the sampling frequency,
which is 0.5 in this example. Above that point, the filter passes nothing at all. This chart
is a typical frequency response chart for a component. The trouble is, it’s impossible to
build a filter that can do this. We must make compromises to achieve a suitable antialias
filter design.
So what problems exist with designing the perfect filter, as shown in the figure?
EXPENSE
An ideal antialias filter with an infinitely steep rolloff (defined shortly) like that in the
figure cannot be made. Filters are made with real-world components that have defini-
tive, complex impedances. This means the filter will have a transfer function that
reduces to differential equations with continuous solutions. This is all a complex way
to say that the filter’s frequency transfer chart will not have vertical rolloff lines. The
filter must have curves and ramps. The vertical dropoff shown in the ideal filter will
actually have to roll off with a less vertical drop. The more vertical the drop, the more
expensive and complicated the filter must be. This puts us in a bind. If we want a more
perfect filter, our expense goes up. If we want to save money, we will have to settle for
a less perfect filter.
The typical solution is to put the antialias filter at a frequency a bit lower than the
Nyquist Frequency and roll it off at a more gentle (cheaper) angle. A very similar solu-
tion is to put an imperfect antialias filter at the Nyquist Frequency and then move the
sampling frequency up about 20 percent. We’ll look at filter design shortly.