
Page 57 - Anatomy of a Robot
P. 57
02_200256_CH02/Bergren 4/17/03 11:23 AM Page 42
42 CHAPTER TWO
Every individual curve in the figures represents the predicted behavior of a second-
order control system given specific design parameters that are affected by B, K, and m.
Every curve on the figures is normalized and shows a control system that will eventu-
ally settle to the value of 1. Because of the design differences (reflected in each curve),
they behave differently. The key for us is to learn how these curves behave and how to
control them.
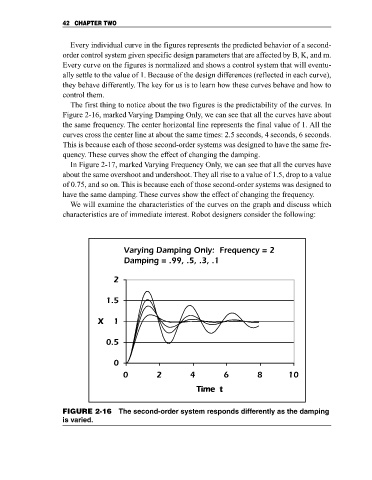
The first thing to notice about the two figures is the predictability of the curves. In
Figure 2-16, marked Varying Damping Only, we can see that all the curves have about
the same frequency. The center horizontal line represents the final value of 1. All the
curves cross the center line at about the same times: 2.5 seconds, 4 seconds, 6 seconds.
This is because each of those second-order systems was designed to have the same fre-
quency. These curves show the effect of changing the damping.
In Figure 2-17, marked Varying Frequency Only, we can see that all the curves have
about the same overshoot and undershoot. They all rise to a value of 1.5, drop to a value
of 0.75, and so on. This is because each of those second-order systems was designed to
have the same damping. These curves show the effect of changing the frequency.
We will examine the characteristics of the curves on the graph and discuss which
characteristics are of immediate interest. Robot designers consider the following:
Varying Damping Only: Frequency = 2
Damping = .99, .5, .3, .1
2
1.5
X X X X 1
0.5
0
0 2 4 6 8 10
Time t
Time tTime t
Time t
FIGURE 2-16 The second-order system responds differently as the damping
is varied.