
Page 46 - Anthropometry, Apparel Sizing and Design
P. 46
42 Anthropometry, Apparel Sizing and Design
Fig. 2.9 Distribution of the error and the relationship between the 95% confidence interval of
the mean error and the maximum allowable error using the data of Table 2.2. S.D., standard
deviation; S.E., standard error.
of the length is used as a test object. An artifact is used because only by using a test
object with actual values we can evaluate the accuracy of the measured data. This pro-
cedure may provide a basis for the agreement on the quality of scan-derived surface
shape between the data providers and data users.
In ISO 20685-2 a ball is measured at nine different positions within the scanning
volume of a whole-body scanner to be evaluated. A function of the sphere is fitted to
the scanned point cloud, and the diameter is calculated. The error of the diameter mea-
surement is calculated as the difference between the measured diameter (d calculated in
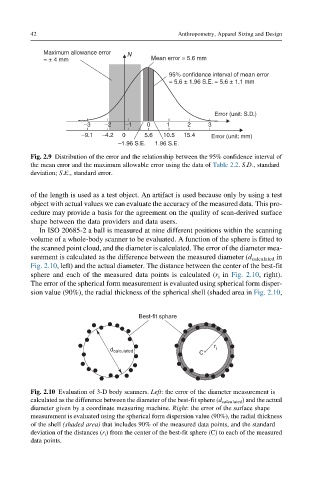
Fig. 2.10, left) and the actual diameter. The distance between the center of the best-fit
sphere and each of the measured data points is calculated (r i in Fig. 2.10, right).
The error of the spherical form measurement is evaluated using spherical form disper-
sion value (90%), the radial thickness of the spherical shell (shaded area in Fig. 2.10,
Best-fit sphare
r
d calculated i
C
Fig. 2.10 Evaluation of 3-D body scanners. Left: the error of the diameter measurement is
calculated as the difference between the diameter of the best-fit sphere (d calculated ) and the actual
diameter given by a coordinate measuring machine. Right: the error of the surface shape
measurement is evaluated using the spherical form dispersion value (90%), the radial thickness
of the shell (shaded area) that includes 90% of the measured data points, and the standard
deviation of the distances (r i ) from the center of the best-fit sphere (C) to each of the measured
data points.