Page 449 - Applied Numerical Methods Using MATLAB
P. 449
438    PARTIAL DIFFERENTIAL EQUATIONS
           Example 9.8. A Parabolic PDE: Two-Dimensional Temperature Diffusion Over
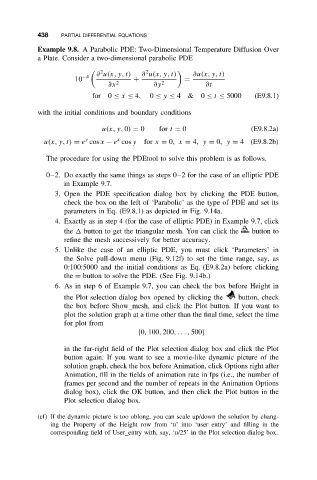
           a Plate. Consider a two-dimensional parabolic PDE
                            ∂ u(x, y, t)  ∂ u(x, y, t)  ∂u(x,y,t)
                             2           2
                        −4
                      10              +             =
                               ∂x 2         ∂y 2          ∂t
                           for 0 ≤ x ≤ 4,  0 ≤ y ≤ 4  &  0 ≤ t ≤ 5000   (E9.8.1)
           with the initial conditions and boundary conditions

                             u(x, y, 0) = 0  for t = 0                 (E9.8.2a)
                         y
                                  x
             u(x, y, t) = e cos x − e cos y  for x = 0,x = 4,y = 0,y = 4 (E9.8.2b)
              The procedure for using the PDEtool to solve this problem is as follows.

              0–2. Do exactly the same things as steps 0–2 for the case of an elliptic PDE
                   in Example 9.7.
                3. Open the PDE specification dialog box by clicking the PDE button,
                   check the box on the left of ‘Parabolic’ as the type of PDE and set its
                   parameters in Eq. (E9.8.1) as depicted in Fig. 9.14a.
                4. Exactly as in step 4 (for the case of elliptic PDE) in Example 9.7, click
                   the   button to get the triangular mesh. You can click the  button to
                   refine the mesh successively for better accuracy.
                5. Unlike the case of an elliptic PDE, you must click ‘Parameters’ in
                   the Solve pull-down menu (Fig. 9.12f) to set the time range, say, as
                   0:100:5000 and the initial conditions as Eq. (E9.8.2a) before clicking
                   the = button to solve the PDE. (See Fig. 9.14b.)
                6. As in step 6 of Example 9.7, you can check the box before Height in
                   the Plot selection dialog box opened by clicking the  button, check
                   the box before Show mesh, and click the Plot button. If you want to
                   plot the solution graph at a time other than the final time, select the time
                   for plot from
                                       {0, 100, 200,... , 500}

                   in the far-right field of the Plot selection dialog box and click the Plot
                   button again. If you want to see a movie-like dynamic picture of the
                   solution graph, check the box before Animation, click Options right after
                   Animation, fill in the fields of animation rate in fps (i.e., the number of
                   frames per second and the number of repeats in the Animation Options
                   dialog box), click the OK button, and then click the Plot button in the
                   Plot selection dialog box.

           (cf) If the dynamic picture is too oblong, you can scale up/down the solution by chang-
               ing the Property of the Height row from ‘u’ into ‘user entry’ and filling in the
               corresponding field of User entry with, say, ‘u/25’ in the Plot selection dialog box.

