
Page 503 - Applied Numerical Methods Using MATLAB
P. 503
492 MATLAB
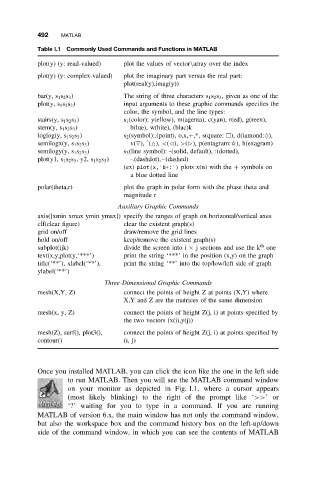
Table I.1 Commonly Used Commands and Functions in MATLAB
plot(y) (y: read-valued) plot the values of vector\array over the index
plot(y) (y: complex-valued) plot the imaginary part versus the real part:
plot(real(y),imag(y))
bar(y, s 1 s 2 s 3 ) The string of three characters s 1 s 2 s 3 , given as one of the
plot(y, s 1 s 2 s 3 ) input arguments to these graphic commands specifies the
color, the symbol, and the line types:
stairs(y, s 1 s 2 s 3 ) s 1 (color): y(ellow), m(agenta), c(yan), r(ed), g(reen),
stem(y, s 1 s 2 s 3 ) b(lue), w(hite), (blac)k
loglog(y, s 1 s 2 s 3 ) s 2 (symbol):.(point), o,x,+,*, s(quare: ), d(iamond:♦),
semilogx(y, s 1 s 2 s 3 ) v( ), ˆ( ), <( ), >( ), p(entagram:✩), h(exagram)
semilogy(y, s 1 s 2 s 3 ) s 3 (line symbol): -(solid, default), :(dotted),
plot(y1, s 1 s 2 s 3 , y2, s 1 s 2 s 3 ) -.(dashdot),–(dashed)
(ex) plot(x,’b+:’) plots x(n) with the + symbols on
a blue dotted line
polar(theta,r) plot the graph in polar form with the phase theta and
magnitude r
Auxiliary Graphic Commands
axis([xmin xmax ymin ymax]) specify the ranges of graph on horizontal/vertical axes
clf(clear figure) clear the existent graph(s)
grid on/off draw/remove the grid lines
hold on/off keep/remove the existent graph(s)
th
subplot(ijk) divide the screen into i × j sections and use the k one
text(x,y,plot(y,‘***’) print the string ‘***’ in the position (x,y) on the graph
title(‘**’), xlabel(‘**’), print the string ‘**’ into the top/low/left side of graph
ylabel(‘**’)
Three-Dimensional Graphic Commands
mesh(X,Y, Z) connect the points of height Z at points (X,Y) where
X,Y and Z are the matrices of the same dimension
mesh(x, y, Z) connect the points of height Z(j, i) at points specified by
the two vectors (x(i),y(j))
mesh(Z), surf(), plot3(), connect the points of height Z(j, i) at points specified by
contour() (i, j)
Once you installed MATLAB, you can click the icon like the one in the left side
to run MATLAB. Then you will see the MATLAB command window
on your monitor as depicted in Fig. I.1, where a cursor appears
(most likely blinking) to the right of the prompt like ‘>>’or
‘?’ waiting for you to type in a command. If you are running
MATLAB of version 6.x, the main window has not only the command window,
but also the workspace box and the command history box on the left-up/down
side of the command window, in which you can see the contents of MATLAB