
Page 264 - Applied Petroleum Geomechanics
P. 264
Abnormal pore pressure mechanisms 255
Illite : r ¼ 3:044 0:00505Dt (7.9)
i
3
where r s and r i are the bulk densities in smectite and illite (g/cm ), respec-
tively; Dt is the sonic transit time (ms/ft).
Therefore, the following relation can be used to identify smectite and
illite transition:
Dr ¼ r ða bDtÞ (7.10)
b
s
where Dr s is the difference between the bulk density measured from den-
3
sity log and the bulk density in the smectite (g/cm ); a ¼ 2.981,
b ¼ 0.00511 from Eq. (7.8).
When Dr s 0, the shale should be smectite-dominated. Otherwise,
when Dr s > 0, the shale should be illite-dominated. Therefore, the SeI
transition can also be identified from the bulk density curve where an
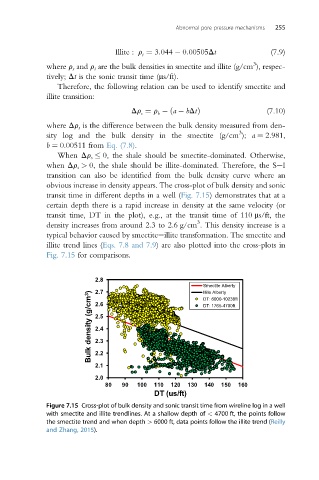
obvious increase in density appears. The cross-plot of bulk density and sonic
transit time in different depths in a well (Fig. 7.15) demonstrates that at a
certain depth there is a rapid increase in density at the same velocity (or
transit time, DT in the plot), e.g., at the transit time of 110 ms/ft, the
3
density increases from around 2.3 to 2.6 g/cm . This density increase is a
typical behavior caused by smectiteeillite transformation. The smectite and
illite trend lines (Eqs. 7.8 and 7.9) are also plotted into the cross-plots in
Fig. 7.15 for comparisons.
2.8
Smectite Alberty
2.7
Illite Alberty
Bulk density (g/cm 3 ) 2.5
DT: 6000-10238ft
2.6
DT: 1765-4700ft
2.4
2.3
2.2
2.1
2.0
80 90 100 110 120 130 140 150 160
DT (us/ft)
Figure 7.15 Cross-plot of bulk density and sonic transit time from wireline log in a well
with smectite and illite trendlines. At a shallow depth of < 4700 ft, the points follow
the smectite trend and when depth > 6000 ft, data points follow the illite trend (Reilly
and Zhang, 2015).