
Page 265 - Applied Petroleum Geomechanics
P. 265
256 Applied Petroleum Geomechanics
2.8
Normal pressure
Overpressure
Density in shale (g/cm 3 ) 2.5
2.7
Smectite Alberty
Illite Alberty
2.6
2.4
2.3
2.2
2.1
2.0
60 70 80 90 100 110 120 130 140 150 160
DT in shale (us/ft)
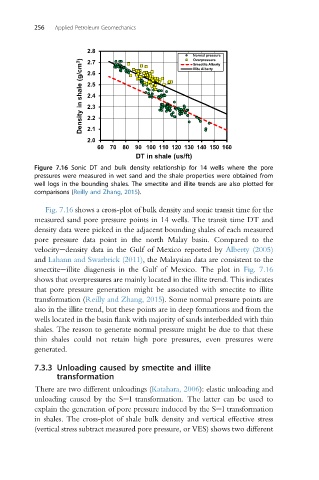
Figure 7.16 Sonic DT and bulk density relationship for 14 wells where the pore
pressures were measured in wet sand and the shale properties were obtained from
well logs in the bounding shales. The smectite and illite trends are also plotted for
comparisons (Reilly and Zhang, 2015).
Fig. 7.16 shows a cross-plot of bulk density and sonic transit time for the
measured sand pore pressure points in 14 wells. The transit time DT and
density data were picked in the adjacent bounding shales of each measured
pore pressure data point in the north Malay basin. Compared to the
velocityedensity data in the Gulf of Mexico reported by Alberty (2005)
and Lahann and Swarbrick (2011), the Malaysian data are consistent to the
smectiteeillite diagenesis in the Gulf of Mexico. The plot in Fig. 7.16
shows that overpressures are mainly located in the illite trend. This indicates
that pore pressure generation might be associated with smectite to illite
transformation (Reilly and Zhang, 2015). Some normal pressure points are
also in the illite trend, but these points are in deep formations and from the
wells located in the basin flank with majority of sands interbedded with thin
shales. The reason to generate normal pressure might be due to that these
thin shales could not retain high pore pressures, even pressures were
generated.
7.3.3 Unloading caused by smectite and illite
transformation
There are two different unloadings (Katahara, 2006): elastic unloading and
unloading caused by the SeI transformation. The latter can be used to
explain the generation of pore pressure induced by the SeI transformation
in shales. The cross-plot of shale bulk density and vertical effective stress
(vertical stress subtract measured pore pressure, or VES) shows two different