
Page 42 - Applied Petroleum Geomechanics
P. 42
Rock physical and mechanical properties 33
and V p in ft/s), a ¼ 0.23 and b ¼ 0.25 are used as the default values by
Gardner et al. (1974).
Eq. (2.2) represents a fair average for a large number of laboratory and
field observations of different brine-saturated rock types. For practical
applications, a calibration is needed to adjust two constants of a and b in
Eq. (2.2). Additionally, the compressional velocity can be slowed down by
hydrocarbon formations. In this case the compressional velocity should be
corrected to take out hydrocarbon impacts in oil- and gas-bearing forma-
tions (refer to Section 2.3.5).
2.1.2 Bulk density at the shallow depth
As mentioned above, bulk density in the shallow formation may not be
available in most cases, but it is a required parameter for calculating the
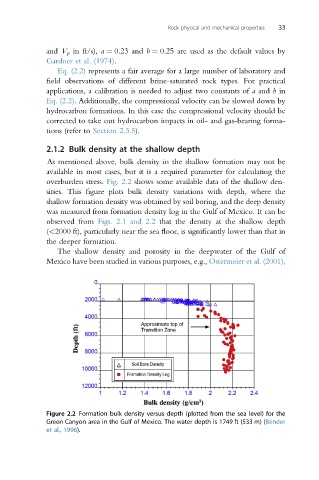
overburden stress. Fig. 2.2 shows some available data of the shallow den-
sities. This figure plots bulk density variations with depth, where the
shallow formation density was obtained by soil boring, and the deep density
was measured from formation density log in the Gulf of Mexico. It can be
observed from Figs. 2.1 and 2.2 that the density at the shallow depth
(<2000 ft), particularly near the sea floor, is significantly lower than that in
the deeper formation.
The shallow density and porosity in the deepwater of the Gulf of
Mexico have been studied in various purposes, e.g., Ostermeier et al. (2001),
Figure 2.2 Formation bulk density versus depth (plotted from the sea level) for the
Green Canyon area in the Gulf of Mexico. The water depth is 1749 ft (533 m) (Bender
et al., 1996).