
Page 140 - Applied Photovoltaics
P. 140
consumed by the load. Consequently, the curve of Fig. 7.1 becomes approximately
linear for photovoltaic availability in the range 0–80%.
7.3 HYBRID SYSTEMS
In some applications, it is both economical and desirable to use a hybrid system,
whereby the PV supplies some or most of the load, but with a diesel or petrol
generator as a backup. This allows the PV system to be designed to quite a low
availability, usually resulting in considerable savings on battery capacity and to a
lesser extent on PV panels. Obviously, for many applications, particularly in remote
areas, generators and PV are quite incompatible. However, for applications such as
homesteads, where on-site labour is available for maintenance, they should be
seriously considered, especially when a system design falls within the region in
Fig. 7.2 labelled consider hybrid.
Using the hybrid indicator
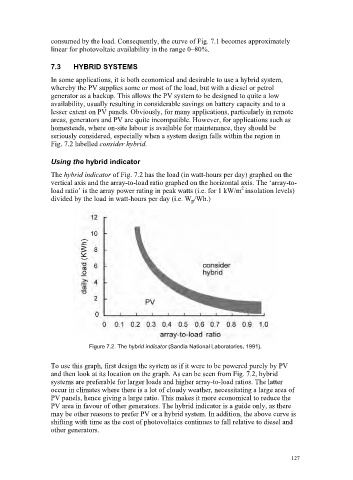
The hybrid indicator of Fig. 7.2 has the load (in watt-hours per day) graphed on the
vertical axis and the array-to-load ratio graphed on the horizontal axis. The ‘array-to-
2
load ratio’ is the array power rating in peak watts (i.e. for 1 kW/m insolation levels)
divided by the load in watt-hours per day (i.e. W /Wh.)
p
Figure 7.2. The hybrid indicator (Sandia National Laboratories, 1991).
To use this graph, first design the system as if it were to be powered purely by PV
and then look at its location on the graph. As can be seen from Fig. 7.2, hybrid
systems are preferable for larger loads and higher array-to-load ratios. The latter
occur in climates where there is a lot of cloudy weather, necessitating a large area of
PV panels, hence giving a large ratio. This makes it more economical to reduce the
PV area in favour of other generators. The hybrid indicator is a guide only, as there
may be other reasons to prefer PV or a hybrid system. In addition, the above curve is
shifting with time as the cost of photovoltaics continues to fall relative to diesel and
other generators.
127