
Page 179 - Applied Photovoltaics
P. 179
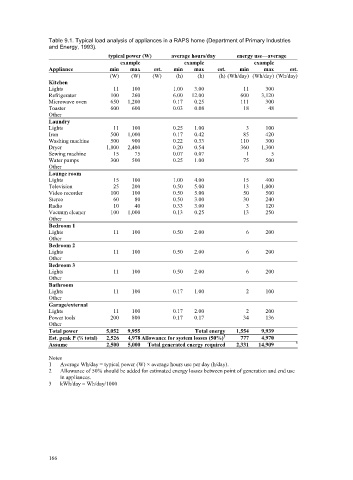
Table 9.1. Typical load analysis of appliances in a RAPS home (Department of Primary Industries
                     and Energy, 1993).
                                      typical power (W)   average hours/day   energy use—average
                                          example           example              example
                     Appliance         min   max    est.  min  max    est.  min    max     est.
                                       (W)   (W)   (W)    (h)   (h)   (h) (Wh/day) (Wh/day) (Wh/day)
                     Kitchen
                     Lights             11   100         1.00  3.00           11    300
                     Refrigerator      100   260         6.00  12.00         600   3,120
                     Microwave oven    650  1,200        0.17  0.25          111    300
                     Toaster           600   600         0.03  0.08           18     48
                     Other
                     Laundry
                     Lights             11   100         0.25  1.00           3     100
                     Iron              500  1,000        0.17  0.42           85    420
                     Washing machine   500   900         0.22  0.33          110    300
                     Dryer            1,800  2,400       0.20  0.54          360   1,300
                     Sewing machine     15    75         0.07  0.07           1       5
                     Water pumps       300   500         0.25  1.00           75    500
                     Other
                     Lounge room
                     Lights             15   100         1.00  4.00           15    400
                     Television         25   200         0.50  5.00           13   1,000
                     Video recorder    100   100         0.50  5.00           50    500
                     Stereo             60    80         0.50  3.00           30    240
                     Radio              10    40         0.33  3.00           3     120
                     Vacuum cleaner    100  1,000        0.13  0.25           13    250
                     Other
                     Bedroom 1
                     Lights             11   100         0.50  2.00           6     200
                     Other
                     Bedroom 2
                     Lights             11   100         0.50  2.00           6     200
                     Other
                     Bedroom 3
                     Lights             11   100         0.50  2.00           6     200
                     Other
                     Bathroom
                     Lights             11   100         0.17  1.00           2     100
                     Other
                     Garage/external
                     Lights             11   100         0.17  2.00           2     200
                     Power tools       200   800         0.17  0.17          34     136
                     Other
                     Total power      5,052  9,955              Total energy  1,554  9,939
                     Est. peak P (½ total)   2,526  4,978 Allowance for system losses (50%) 2  777  4,970
                     Assume           2,500  5,000  Total generated energy required  2,331  14,909  3

                     Notes
                     1   Average Wh/day = typical power (W) × average hours use per day (h/day).
                     2    Allowance of 50% should be added for estimated energy losses between point of generation and end use
                         in appliances.
                     3   kWh/day  = Wh/day/1000


                     166