
Page 24 - Applied Photovoltaics
P. 24
Clearly, human activities have now reached a scale where they are impacting on the
planet’s self-support systems. The side-effects could be devastating and technologies
with low environmental impact and low ‘greenhouse gas’ emissions will increase in
importance over the coming decades. Since the energy sector is the major producer of
greenhouse gases via the combustion of fossil fuels, technologies such as
photovoltaics, which can be substituted for fossil fuels, should increasingly be used
(Blakers et al., 1991).
1.7 APPARENT MOTION OF THE SUN
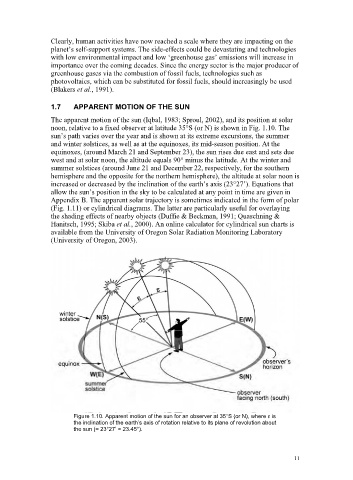
The apparent motion of the sun (Iqbal, 1983; Sproul, 2002), and its position at solar
noon, relative to a fixed observer at latitude 35°S (or N) is shown in Fig. 1.10. The
sun’s path varies over the year and is shown at its extreme excursions, the summer
and winter solstices, as well as at the equinoxes, its mid-season position. At the
equinoxes, (around March 21 and September 23), the sun rises due east and sets due
west and at solar noon, the altitude equals 90° minus the latitude. At the winter and
summer solstices (around June 21 and December 22, respectively, for the southern
hemisphere and the opposite for the northern hemisphere), the altitude at solar noon is
increased or decreased by the inclination of the earth’s axis (23°27’). Equations that
allow the sun’s position in the sky to be calculated at any point in time are given in
Appendix B. The apparent solar trajectory is sometimes indicated in the form of polar
(Fig. 1.11) or cylindrical diagrams. The latter are particularly useful for overlaying
the shading effects of nearby objects (Duffie & Beckman, 1991; Quaschning &
Hanitsch, 1995; Skiba et al., 2000). An online calculator for cylindrical sun charts is
available from the University of Oregon Solar Radiation Monitoring Laboratory
(University of Oregon, 2003).
Figure 1.10. Apparent motion of the sun for an observer at 35°S (or N), where İ is
the inclination of the earth’s axis of rotation relative to its plane of revolution about
the sun (= 23°27’ = 23.45°).
11