
Page 28 - Applied Photovoltaics
P. 28
regression ‘constants’ extracted from measured data at various locations, and N is
d
*
the monthly average day length = 152 Ȧ .
s
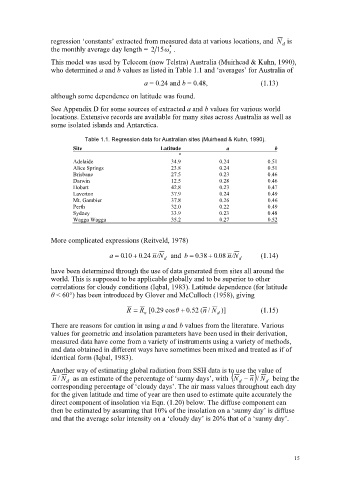
This model was used by Telecom (now Telstra) Australia (Muirhead & Kuhn, 1990),
who determined a and b values as listed in Table 1.1 and ‘averages’ for Australia of
a = 0.24 and b = 0.48, (1.13)
although some dependence on latitude was found.
See Appendix D for some sources of extracted a and b values for various world
locations. Extensive records are available for many sites across Australia as well as
some isolated islands and Antarctica.
Table 1.1. Regression data for Australian sites (Muirhead & Kuhn, 1990).
Site Latitude a b
°
Adelaide 34.9 0.24 0.51
Alice Springs 23.8 0.24 0.51
Brisbane 27.5 0.23 0.46
Darwin 12.5 0.28 0.46
Hobart 42.8 0.23 0.47
Laverton 37.9 0.24 0.49
Mt. Gambier 37.8 0.26 0.46
Perth 32.0 0.22 0.49
Sydney 33.9 0.23 0.48
Wagga Wagga 35.2 0.27 0.52
More complicated expressions (Reitveld, 1978)
a 0 .10 0 .24 N / n and b 0 .38 0 .08 N / n (1.14)
d d
have been determined through the use of data generated from sites all around the
world. This is supposed to be applicable globally and to be superior to other
correlations for cloudy conditions (Iqbal, 1983). Latitude dependence (for latitude
ș < 60°) has been introduced by Glover and McCulloch (1958), giving
R R . 0 [ 29 cosș . 0 52 (n / N )] (1.15)
o d
There are reasons for caution in using a and b values from the literature. Various
values for geometric and insolation parameters have been used in their derivation,
measured data have come from a variety of instruments using a variety of methods,
and data obtained in different ways have sometimes been mixed and treated as if of
identical form (Iqbal, 1983).
Another way of estimating global radiation from SSH data is to use the value of
N
n / N as an estimate of the percentage of ‘sunny days’, with d n / N being the
d
d
corresponding percentage of ‘cloudy days’. The air mass values throughout each day
for the given latitude and time of year are then used to estimate quite accurately the
direct component of insolation via Eqn. (1.20) below. The diffuse component can
then be estimated by assuming that 10% of the insolation on a ‘sunny day’ is diffuse
and that the average solar intensity on a ‘cloudy day’ is 20% that of a ‘sunny day’.
15