
Page 30 - Applied Photovoltaics
P. 30
c
d
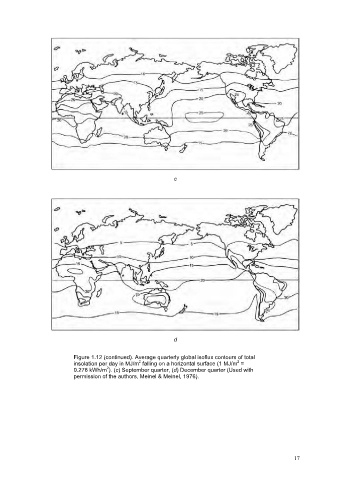
Figure 1.12 (continued). Average quarterly global isoflux contours of total
2
2
insolation per day in MJ/m falling on a horizontal surface (1 MJ/m =
2
0.278 kWh/m ). (c) September quarter, (d) December quarter (Used with
permission of the authors, Meinel & Meinel, 1976).
17