
Page 202 - Applied Probability
P. 202
9. Descent Graph Methods
Except for the gradual lowering of temperature and the above indicated
revision of the acceptance probability, the remaining details of simulated
annealing exactly parallel the Markov chain simulations employed in cal-
culating location scores.
9.10 Application to Episodic Ataxia 187
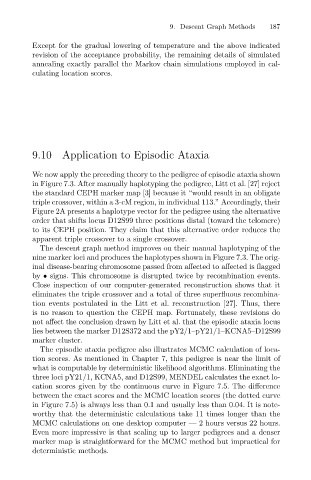
We now apply the preceding theory to the pedigree of episodic ataxia shown
in Figure 7.3. After manually haplotyping the pedigree, Litt et al. [27] reject
the standard CEPH marker map [3] because it “would result in an obligate
triple crossover, within a 3-cM region, in individual 113.” Accordingly, their
Figure 2A presents a haplotype vector for the pedigree using the alternative
order that shifts locus D12S99 three positions distal (toward the telomere)
to its CEPH position. They claim that this alternative order reduces the
apparent triple crossover to a single crossover.
The descent graph method improves on their manual haplotyping of the
nine marker loci and produces the haplotypes shown in Figure 7.3. The orig-
inal disease-bearing chromosome passed from affected to affected is flagged
by • signs. This chromosome is disrupted twice by recombination events.
Close inspection of our computer-generated reconstruction shows that it
eliminates the triple crossover and a total of three superfluous recombina-
tion events postulated in the Litt et al. reconstruction [27]. Thus, there
is no reason to question the CEPH map. Fortunately, these revisions do
not affect the conclusion drawn by Litt et al. that the episodic ataxia locus
lies between the marker D12S372 and the pY2/1–pY21/1–KCNA5–D12S99
marker cluster.
The episodic ataxia pedigree also illustrates MCMC calculation of loca-
tion scores. As mentioned in Chapter 7, this pedigree is near the limit of
what is computable by deterministic likelihood algorithms. Eliminating the
three loci pY21/1, KCNA5, and D12S99, MENDEL calculates the exact lo-
cation scores given by the continuous curve in Figure 7.5. The difference
between the exact scores and the MCMC location scores (the dotted curve
in Figure 7.5) is always less than 0.1 and usually less than 0.04. It is note-
worthy that the deterministic calculations take 11 times longer than the
MCMC calculations on one desktop computer — 2 hours versus 22 hours.
Even more impressive is that scaling up to larger pedigrees and a denser
marker map is straightforward for the MCMC method but impractical for
deterministic methods.