
Page 68 - Applied Probability
P. 68
3. Newton’s Method and Scoring
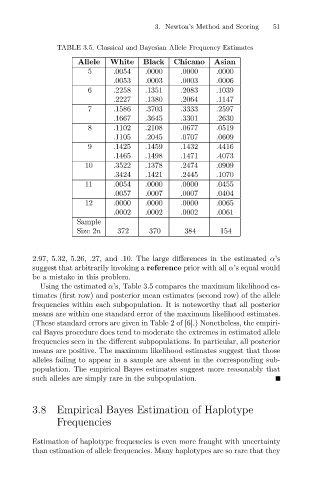
TABLE 3.5. Classical and Bayesian Allele Frequency Estimates
Allele
.0000
.0000
.0000
.0054
5
.0053
.0003
.0006
.0003
.1039
.2258
6 White Black Chicano Asian 51
.1351
.2083
.2227 .1380 .2064 .1147
7 .1586 .3703 .3333 .2597
.1667 .3645 .3301 .2630
8 .1102 .2108 .0677 .0519
.1105 .2045 .0707 .0609
9 .1425 .1459 .1432 .4416
.1465 .1498 .1471 .4073
10 .3522 .1378 .2474 .0909
.3424 .1421 .2445 .1070
11 .0054 .0000 .0000 .0455
.0057 .0007 .0007 .0404
12 .0000 .0000 .0000 .0065
.0002 .0002 .0002 .0061
Sample
Size 2n 372 370 384 154
2.97, 5.32, 5.26, .27, and .10. The large differences in the estimated α’s
suggest that arbitrarily invoking a reference prior with all α’s equal would
be a mistake in this problem.
Using the estimated α’s, Table 3.5 compares the maximum likelihood es-
timates (first row) and posterior mean estimates (second row) of the allele
frequencies within each subpopulation. It is noteworthy that all posterior
means are within one standard error of the maximum likelihood estimates.
(These standard errors are given in Table 2 of [6].) Nonetheless, the empiri-
cal Bayes procedure does tend to moderate the extremes in estimated allele
frequencies seen in the different subpopulations. In particular, all posterior
means are positive. The maximum likelihood estimates suggest that those
alleles failing to appear in a sample are absent in the corresponding sub-
population. The empirical Bayes estimates suggest more reasonably that
such alleles are simply rare in the subpopulation.
3.8 Empirical Bayes Estimation of Haplotype
Frequencies
Estimation of haplotype frequencies is even more fraught with uncertainty
than estimation of allele frequencies. Many haplotypes are so rare that they