
Page 90 - Applied Probability
P. 90
4. Hypothesis Testing and Categorical Data
73
Inspection of Table 4.3 strongly suggests that at the very least, allele 4
of this marker is preferentially transmitted to affecteds. This suspicion is
6
confirmed by the two permutation tests. Out of 10 independent trials,
none of the simulated statistics was as large as the corresponding observed
2
statistics χ =92.91 and Z max =4.69. In fact, there are just a handful of
different AT mutations segregating in this population isolate. Each muta-
tion is defined by a unique haplotype signature involving marker D11S1817
and several other markers closely linked to the AT locus [42].
The early papers on the TDT have prompted many interesting gener-
alizations. For instance, versions of the TDT exist for sibships and even
pedigrees [2, 5, 34, 38, 40]. Other generalizations are described in the pa-
pers [8, 18, 21, 30, 33, 46]. In Chapter 7 we meet a parametric version of
the TDT known as the gamete competition model.
4.9 Problems
1. Test for Hardy-Weinberg equilibrium in the MN Syrian data pre-
sented in Chapter 2.
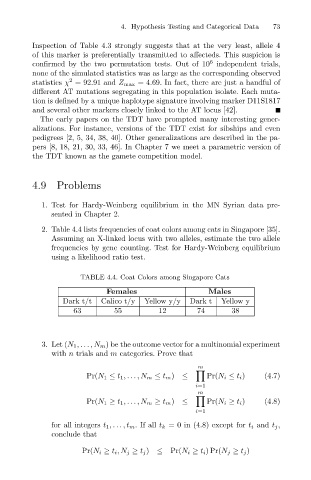
2. Table 4.4 lists frequencies of coat colors among cats in Singapore [35].
Assuming an X-linked locus with two alleles, estimate the two allele
frequencies by gene counting. Test for Hardy-Weinberg equilibrium
using a likelihood ratio test.
TABLE 4.4. Coat Colors among Singapore Cats
Females Males
Dark t/t Calico t/y Yellow y/y Dark t Yellow y
63 55 12 74 38
3. Let (N 1 ,... ,N m ) be the outcome vector for a multinomial experiment
with n trials and m categories. Prove that
m
Pr(N 1 ≤ t 1 ,... ,N m ≤ t m ) ≤ Pr(N i ≤ t i ) (4.7)
i=1
m
Pr(N 1 ≥ t 1 ,... ,N m ≥ t m ) ≤ Pr(N i ≥ t i ) (4.8)
i=1
for all integers t 1 ,...,t m .Ifall t k = 0 in (4.8) except for t i and t j ,
conclude that
Pr(N i ≥ t i ,N j ≥ t j ) ≤ Pr(N i ≥ t i ) Pr(N j ≥ t j )