
Page 85 - Applied Probability
P. 85
4. Hypothesis Testing and Categorical Data
68
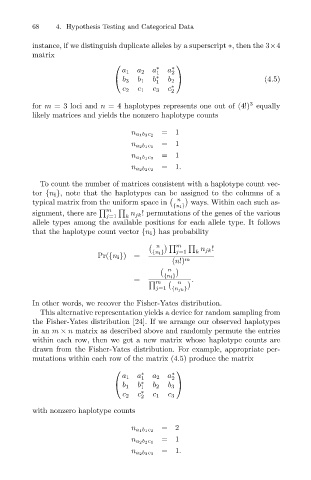
instance, if we distinguish duplicate alleles by a superscript ∗, then the 3×4
matrix
a 1
b
b 2
b 1
b 3
1
c
c 2 a 2 a ∗ ∗ 1 a ∗ ∗ 2 (4.5)
c 3
c 1
2
3
for m = 3 loci and n = 4 haplotypes represents one out of (4!) equally
likely matrices and yields the nonzero haplotype counts
=1
n a 1 b 3 c 2
=1
n a 2 b 1 c 1
=1
n a 1 b 1 c 3
=1.
n a 2 b 2 c 2
To count the number of matrices consistent with a haplotype count vec-
tor {n i }, note that the haplotypes can be assigned to the columns of a
n
typical matrix from the uniform space in ways. Within each such as-
{n i }
m
signment, there are n jk ! permutations of the genes of the various
j=1 k
allele types among the available positions for each allele type. It follows
that the haplotype count vector {n i } has probability
n n jk !
m
Pr({n i })= {n i } j=1 k
(n!) m
n
{n i }
= m n .
j=1 {n jk }
In other words, we recover the Fisher-Yates distribution.
This alternative representation yields a device for random sampling from
the Fisher-Yates distribution [24]. If we arrange our observed haplotypes
in an m × n matrix as described above and randomly permute the entries
within each row, then we get a new matrix whose haplotype counts are
drawn from the Fisher-Yates distribution. For example, appropriate per-
mutations within each row of the matrix (4.5) produce the matrix
∗ ∗
a 1 a 1 a 2 a 2
b 1 b ∗ 1 b 2 b 3
c 2 c ∗ 2 c 1 c 3
with nonzero haplotype counts
=2
n a 1 b 1 c 2
=1
n a 2 b 2 c 1
=1.
n a 2 b 3 c 3