
Page 81 - Applied Probability
P. 81
4. Hypothesis Testing and Categorical Data
64
If m[1 − Φ(z max)] is small, then the bound (4.1) will be an excellent ap-
proximation to the p-value.
The first inequality in (4.2) is an example of an inclusion-exclusion
bound. To prove it, take expectations in the inequality
m
m ≥ − 1 (4.3)
1 ∪ A i 1 A i 1 A i A j
i=1
i=1 i<j
involving indicator functions. To establish the inequality (4.3), suppose
that a sample point belongs to exactly k of the events A i .If k = 0, then
k
inequality (4.3) is trivial. If k> 0, then inequality (4.3) becomes 1 ≥ k− 2 ,
2
which is logically equivalent to k − 3k +2 = (k − 2)(k − 1) ≥ 0. The
replacement Pr(A i ∩A j ) ≤ Pr(A i )Pr(A j ) in (4.2) can be rigorously justified
[19, 27] as sketched in Problem 3. Note that this inequality reflects the
negative correlation of the multinomial components N i .
Ewens et al. [12] suggest that if the Z max test is highly significant, then
the category i with largest component Z i should be removed and the Z max
statistic recalculated. This entails replacing n by n − N i and each p j by
p j /(1 − p i ) for j = i and computing a new Z max for the reduced data. This
procedure is repeated until all outlying categories have been identified and
Z max is no longer significant.
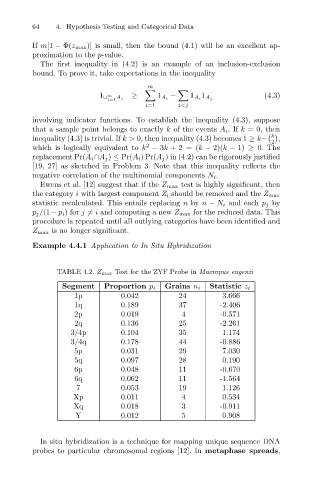
Example 4.4.1 Application to In Situ Hybridization
TABLE 4.2. Z max Test for the ZYF Probe in Macropus eugenii
Segment Proportion p i Grains n i Statistic z i
1p 0.042 24 3.666
1q 0.189 37 -2.406
2p 0.019 4 -0.571
2q 0.136 25 -2.261
3/4p 0.104 35 1.174
3/4q 0.178 44 -0.886
5p 0.031 29 7.030
5q 0.097 28 0.190
6p 0.048 11 -0.670
6q 0.062 11 -1.564
7 0.053 19 1.126
Xp 0.011 4 0.534
Xq 0.018 3 -0.911
Y 0.012 5 0.908
In situ hybridization is a technique for mapping unique sequence DNA
probes to particular chromosomal regions [12]. In metaphase spreads,